








Originally posted 16 June 2026 – Why U.S. Equity Benchmarks are Moving Together and Drifting Apart
By Dr. Mark Shore
Over the decades, U.S. equity indices have transitioned from being heavily concentrated in industrial firms to service and technology sectors. This shift has accelerated in the S&P 500 index (SPX) in recent years where index weightings have increasingly gravitated toward software, cloud computing and artificial intelligence companies.
Has this change in weightings, largely fueled by a small group of highly valued stocks known as the “Magnificent Seven” that are riding the AI boom, fundamentally altered how major equity benchmarks relate to one another? Let’s find out.
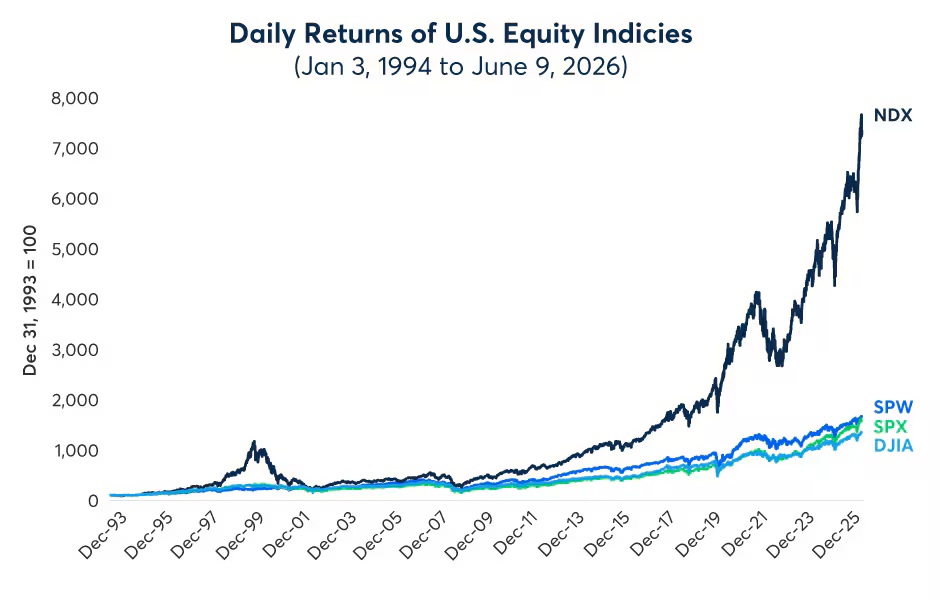
Since 1994, all major indices — the S&P 500 Equal Weighted index (SPW), S&P 500 index (SPX), Nasdaq-100 index (NDX), and the Dow Jones Industrial Average (DJIA) – have been experiencing valuation growth, with NDX outpacing the others briefly during the late 1990’s dot-com bubble and more consistently following the 2008-financial crisis (Fig 1.).
Figure 1: Daily returns of U.S equity indices
Source: Bloomberg (SPW, SPX, NDX, DJI), CME Group Economic Calculations – Past performance is not indicative of future results.
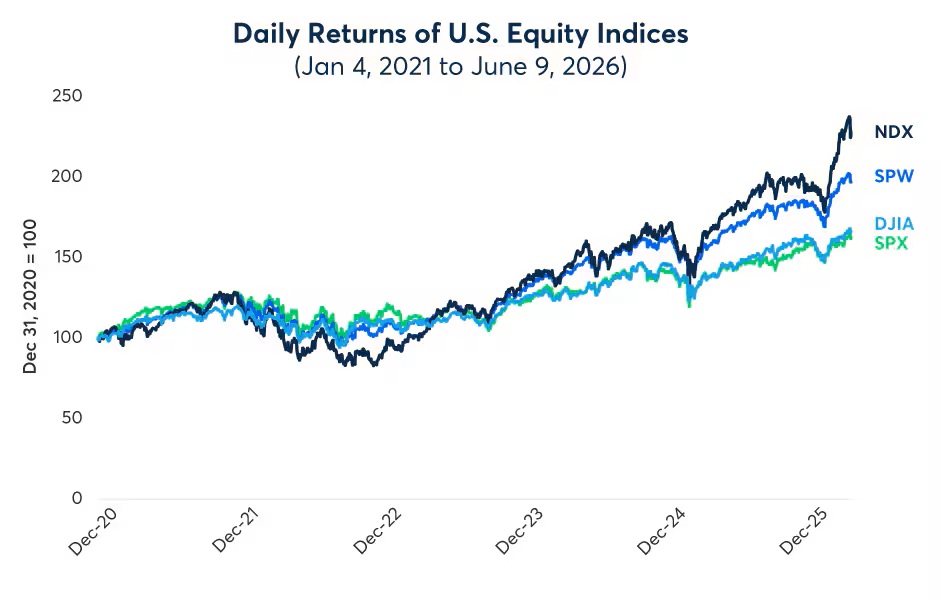
Equity index returns over the last five years show that SPX performance looks more like that of NDX and less like SPW and DJIA (Fig.2).
Figure 2: Daily returns of U.S. equity indices
Source: Bloomberg (SPW, SPX, NDX, DJI), CME Group Economic Calculations – Past performance is not indicative of future results.
Changing Correlations
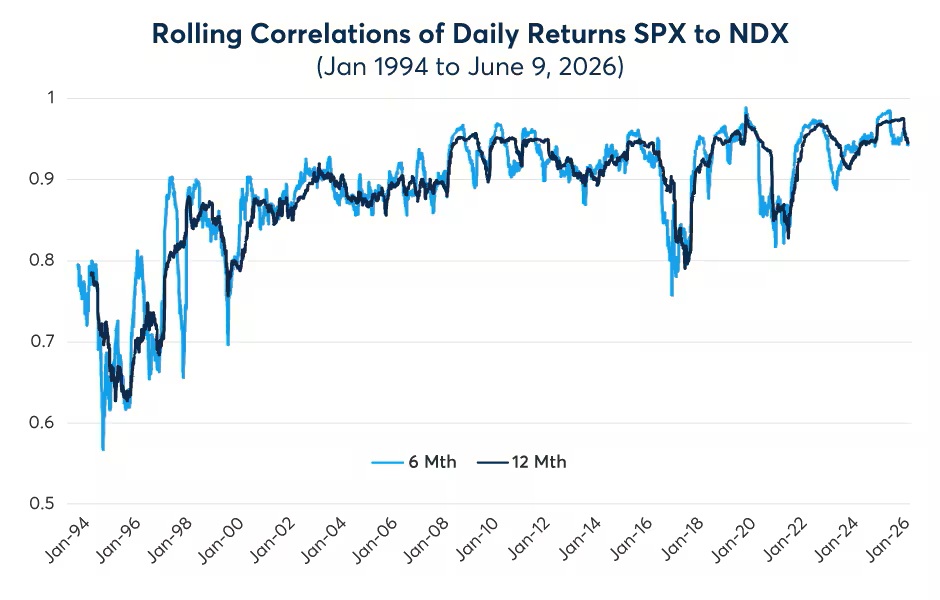
Since 1990, the SPX Information Technology (IT) sector weight has surged from 6.7% to 39.6%.1 From 1995 to about 2009 the daily movements of the S&P 500 and Nasdaq-100 became increasingly in lockstep, with their 6-month and 12-month rolling correlations of daily returns climbing from about 0.6 to 0.96, but with some bouts of correlation volatility. The correlations remained relatively consistent at around 0.9. However, since about 2017, the correlations trended higher as the 12-month rolling correlation reached a new high of 0.98 in March 2026 (Fig. 3).
Figure 3: Rolling Correlations of S&P 500 index to Nasdaq-100 index
Source: Bloomberg (SPX, NDX), CME Group Economic Calculations – Past performance is not indicative of future results.
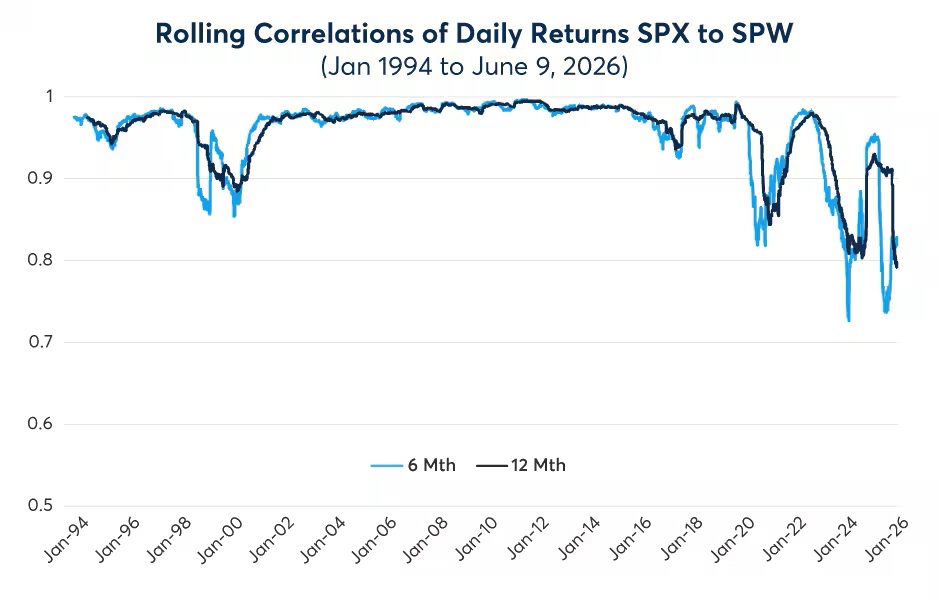
While the rolling correlations between SPX and NDX increased, the rolling correlations of the SPX to SPW declined after years of frequently being above 0.95. Around 2015, the correlation of the S&P 500 index to the S&P Equal Weighted index experienced increased volatility. Since 2020, this correlation trended lower, often experiencing correlations of around 0.8 for both the 6-month and 12-month rolling periods, while experiencing some wide correlation swings (Fig. 4).
Figure 4: Rolling Correlations of S&P 500 index to the S&P Equal Weighted Index
Source: Bloomberg (SPX, SPW), CME Group Economic Calculations – Past performance is not indicative of future results.
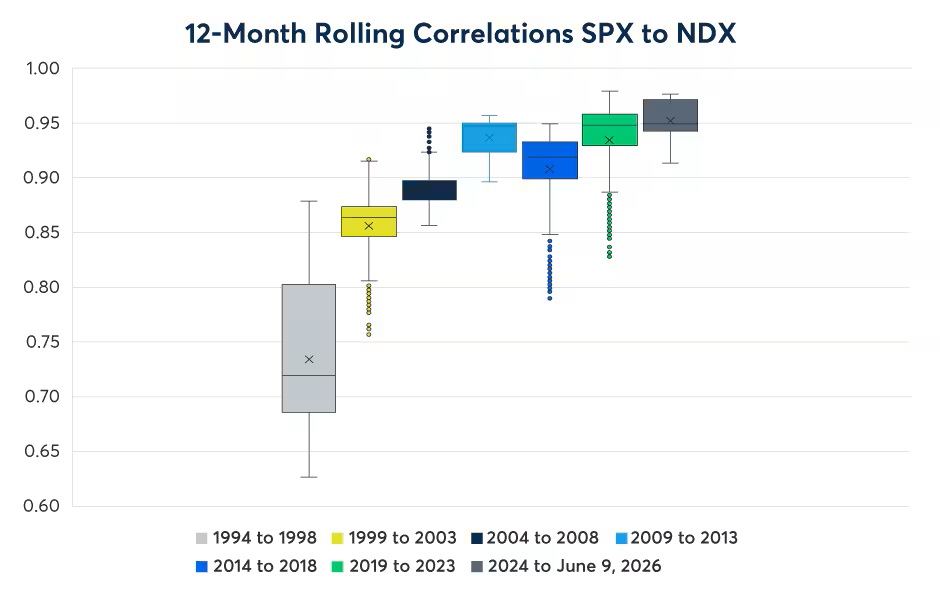
Looking at the 12-month rolling correlation data over five-year segments in box and whisker plots, shows both the dispersion of the rolling correlation for each five-year period and illustrates the increasing correlation trend between SPX to NDX since the 1990s (Fig. 5). Some periods had wide dispersion implying greater correlation volatility. As the correlations trended higher, the average (X) and median (line) also increased from 0.73 to 0.95 and 0.72 to 0.95 respectively.
Figure 5: Box and Whisker plots of SPX to NDX rolling correlations in five-year periods
Source: Bloomberg (SPX, NDX), CME Group Economic Calculations – Past performance is not indicative of future results.
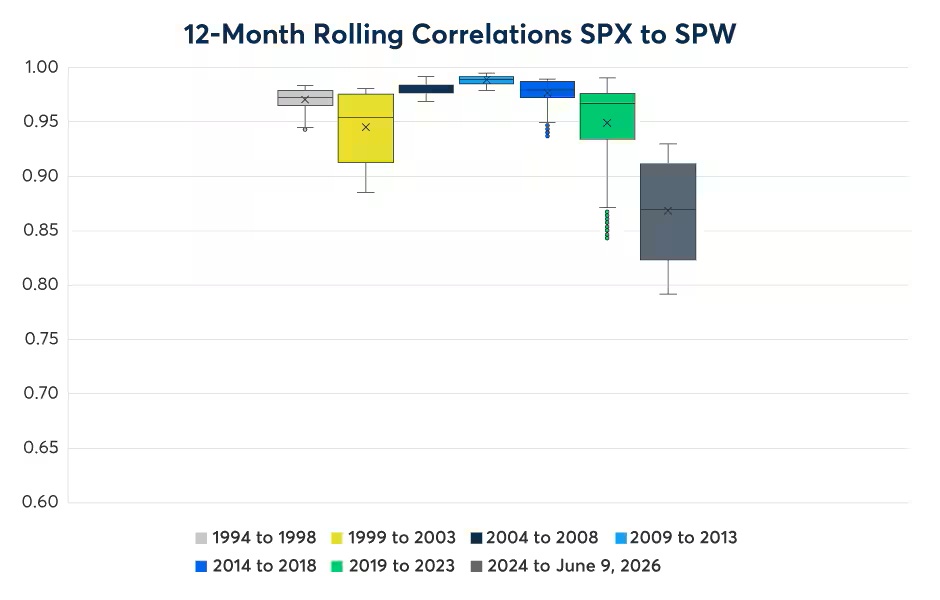
The box and whisker five-year periods of the average correlation of SPX to SPW remained consistently in the 0.95 range through 2018 as the variance of correlations remained consistently low as noted by the narrow boxes with very few outliers (dots below the whiskers). This is likely a result of the SPX’s constituent sector weights being in a tighter band, as the weights frequently remained below the 15% level — except for the 1999 to 2003 period that covered the dot-com bubble when the SPX tech weights increased to about 32.9% in 2000.
However, in 2017, the correlation’s dispersion expanded to the downside as the correlation averages moved from 0.99 to 0.87. Since 1994, this is the lowest correlation between the two indexes (Fig. 6) — another example of growing divergence between the two benchmarks.
Figure 6: Box and Whisker plots of SPX to SPW rolling correlations
Source: Bloomberg (SPX, SPW), CME Group Economic Calculations – Past performance is not indicative of future results.
Why are the correlations changing?
Data suggests that the last 30 years of correlations gradually moved higher between SPX and NDX, especially in the last decade. Simultaneously, SPX and SPW experienced a declining correlation. But the qualitative question remains, why have the correlations changed?
The S&P 500 index is a free-float adjusted, market cap-weighted index, meaning the weights of the constituents may vary depending on the variance of a firm’s capitalization and only the shares that can be publicly traded are included in the assessment. From time to time, this may lead to a small group of stocks or a specific sector leading the index as their valuations increase more than other constituents. In the recent years, that would be the mega-tech companies commonly referred to as the Magnificent Seven.
The S&P 500 Equal Weighted index gives an equal weighting of about 0.2% and is rebalanced quarterly to all constituents in the index.2 Large cap weighted stocks have the same influence on the index as smaller firms. Its relationship with SPX may offer insight on whether the market is moving broadly or if it’s a small group of constituents impacting the SPX’s move.
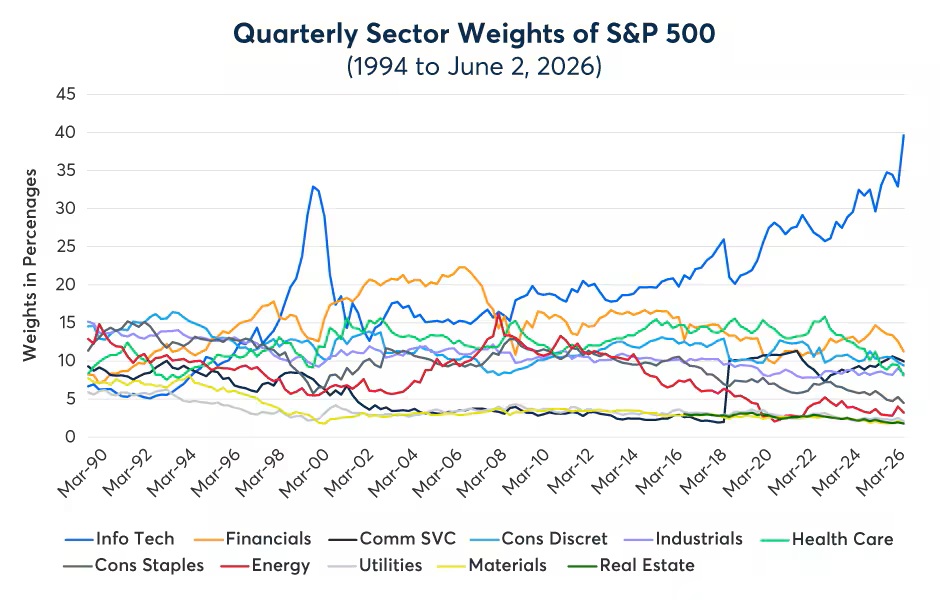
Since 1990, the SPX sector weights have frequently remained below the 15% level. During this time, only a few sectors became maximum weights — the largest percentage of influence that a single sector or small group of stocks holds within an index — including consumer discretion (around 16%) in the early 1990s. However, financials and especially information technology have maintained larger weights and influence on the index (Fig. 7).
Figure 7: S&P 500 Index Quarterly Sector Weights
Source: Bloomberg (S5INFT,S5FINL,S5TELS,S5COND, S5HLTH,S5INDU,S5CONS,S5ENRS,S5UTIL,S5MATR,S5RLST) CME Group Economic Calculations – Past performance is not indicative of future results.
A few examples of the large SPX weights include:
- In the late 1970s the energy sector rallied due to the energy shock and the energy sector weight peaked at around 28% in 1980. Today the energy sector weight is about 3% of SPX.3
- The IT sector weight increased from 7% in 1990 to about 33% by March 2000 during the dot-com bubble. By the early 2000s, the weight reverted to a mid-teen weighting, more in line with the other sectors.
- The financials sector increased to about 20% to 22% range prior to the financial crisis. At that time, real estate was part of the financials sector and eventually became its own sector in 2016. The removal of real estate from the financials sector suggests why the financials sector weight has declined since 2016.
- In 2009 the IT sector began its multi-year run as it broke above the 15% weighting and currently holds about a 39% weighting.4 Many of the same names appear in the top 10 list for NDX,5 and the technology sector currently equates to about 67% weight.
This large weighting to technology suggests why the SPX to NDX correlations have trended higher and the SPX to SPW correlations have trended lower. The second largest NDX sector weighting is consumer discretionary at 17.5%.6
Currently, the top three S&P 500 index sectors by weight include IT (39.6%), Financials (11.3%), and Communication Services (10%).7 These three sectors currently equate to about 61% of index’s weight.
A large weighting of a particular sector or a small group of stocks is not a recent phenomenon. There have been times when an SPX sector experienced increased weights. From the inception of the S&P 500 index in March 1957, the listing of sectors has evolved. Starting with industrials (425 companies or 85%), utilities (60 companies or 12%) and railroads (15 companies or 3%).8 The sectors continued to evolve over time. In 1999 ten Global Industry Classification Standard (GICS) frameworks were introduced to identify sectors with 123 sub-industries and now 11 sectors and 163 sub-industries.9
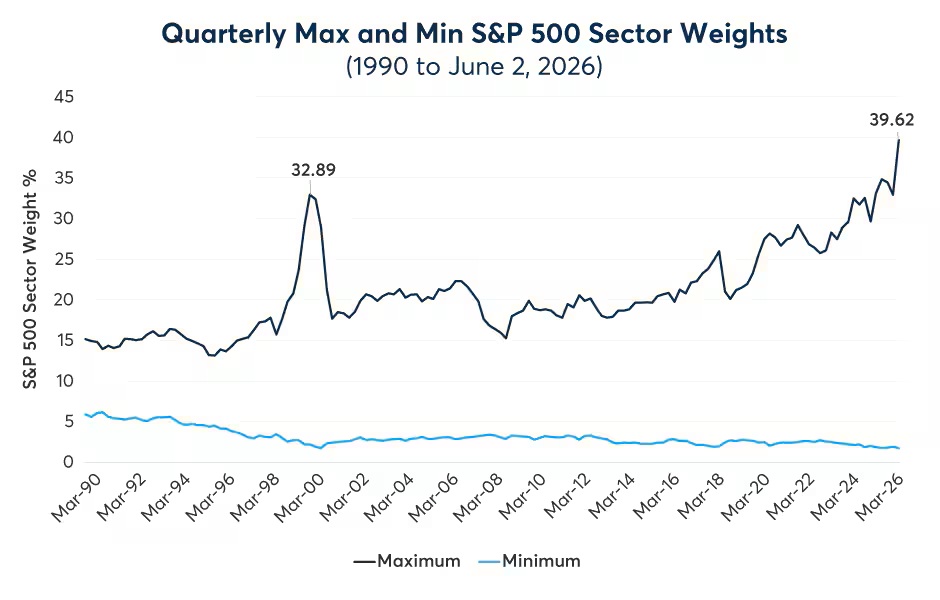
The past ten years have experienced a widening differential between the smallest-weighted sector and the largest-weighted sector. This suggests another reason for the correlation of SPX to SPW to diverge (Fig 8.)
Fig 8: Quarterly Maximum and Minimum S&P 500 Sector Weights
Source: Bloomberg (S5INFT,S5FINL,S5TELS,S5COND,S5HLTH,S5INDU,S5CONS,S5ENRS,S5UTIL,S5MATR,S5RLST), CME Group Economic Calculations – Past performance is not indicative of future results.
Summary
Over the decades, the S&P 500 index experienced moments where one sector had a weighting equating to 20% to 30% or more. Since 1990, the large weights have been dominated by the financial sector and especially the IT sector.
During this time the correlation of SPX to NDX continued to strengthen, currently in the 0.95 range. Simultaneously, the correlation of SPX to SPW has declined in recent years after many years of maintaining a high correlation around 0.95. The data suggests these correlation changes are a result of the weights changing and a growing difference between the largest weighted sector and the smallest weighted sector.
Moments when there is a correction in the heaviest-weighted SPX sector, causing the SPX to decline, may suggest a sector-rotation into other sectors and could result in the SPW increasing or at least hold steady relative to SPX.
Some may argue that the increased weightings cause increased concentration risk due to momentum. Others would argue this is the result of changes in business cycles or economic cycles due to changes in technology and / or new products, services or industries. Or could the answer be a combination of the two arguments where a new industry quietly develops and then hits a tipping point, where a wider audience discovers it?
References
- From March 30, 1990, to June 2, 2026.
- https://www.spglobal.com/spdji/en/indices/equity/sp-500-equal-weight-index/#overview
- https://www.johnsonfinancialgroup.com/resources/blogs/wealth-insights/why-are-stocks-so-resilient-earnings/
- As of June 2, 2026>
- https://www.slickcharts.com/nasdaq100 as of 6/9/26
- https://indexes.nasdaq.com/Index/Breakdown/NDX as of 6/9/26
- As of June 2, 2026
- Bunn, O., & Shiller, R. J. (2014). Changing Times, Changing Values: A Historical Analysis of Sectors within the US Stock Market 1872-2013. SSRN Electronic Journal
- https://www.spglobal.com/spdji/en/documents/education/talking-points-an-overview-of-sp-500-sector-indices-and-25-years-of-gics.pdf
https://www.spglobal.com/spdji/en/index-tv/article/analyzing-the-impact-of-sector-selection
Disclosure: CME Group
© [2023] CME Group Inc. All rights reserved. This information is reproduced by permission of CME Group Inc. and its affiliates under license. CME Group Inc. and its affiliates accept no liability or responsibility for the information contained herein, including but not limited to the currency, accuracy and/or completeness of this information, and delays, interruptions, errors or omissions. This information is an unofficial copy and may not reflect the official and accurate version. For the definitive and up-to-date version of any of this information, please see cmegroup.com.
Disclosure: Interactive Brokers Third Party
Information posted on IBKR Campus that is provided by third-parties does NOT constitute a recommendation that you should contract for the services of that third party. Third-party participants who contribute to IBKR Campus are independent of Interactive Brokers and Interactive Brokers does not make any representations or warranties concerning the services offered, their past or future performance, or the accuracy of the information provided by the third party. Past performance is no guarantee of future results.
This material is from CME Group and is being posted with its permission. The views expressed in this material are solely those of the author and/or CME Group and Interactive Brokers is not endorsing or recommending any investment or trading discussed in the material. This material is not and should not be construed as an offer to buy or sell any security. It should not be construed as research or investment advice or a recommendation to buy, sell or hold any security or commodity. This material does not and is not intended to take into account the particular financial conditions, investment objectives or requirements of individual customers. Before acting on this material, you should consider whether it is suitable for your particular circumstances and, as necessary, seek professional advice.
Disclosure: Futures Trading
Futures are not suitable for all investors. The amount you may lose may be greater than your initial investment. Before trading futures, please read the CFTC Risk Disclosure. A copy and additional information are available at the Warnings and Disclosures section of your local Interactive Brokers website.






Join The Conversation
If you have a general question, it may already be covered in our FAQs page. go to: IBKR Ireland FAQs or IBKR U.K. FAQs. If you have an account-specific question or concern, please reach out to Client Services: IBKR Ireland or IBKR U.K..
Visit IBKR U.K. Open an IBKR U.K. Account