


 The Language of Options and Payout Diagrams (Dutch)")

 Options in Financial Markets (Dutch)")


In theory, if not in practice, moves in major indices should be confirmed by breadth. We tend to focus on indices that are weighted by market capitalization, so many choose to check to see whether a wide range of stocks are participating in a rally that might be disproportionately led by the largest companies. The current environment features one of the most top-heavy index compositions in decades, meaning that a least recently, breadth hasn’t mattered. But historically it has, so we would like to check whether broad-based indices and advance-decline measures are keeping pace with the more concentrated indices.
One simple way to examine the relative amount of market participation is to compare the S&P 500 (SPX) with its equal-weighted version (SPW) and the NYSE Composite Index (NYA). We see that the latter two measures have performed similarly, but significantly worse than SPX:
3-Years, SPX (blue/white candles), SPW (blue line), NYA (red line)
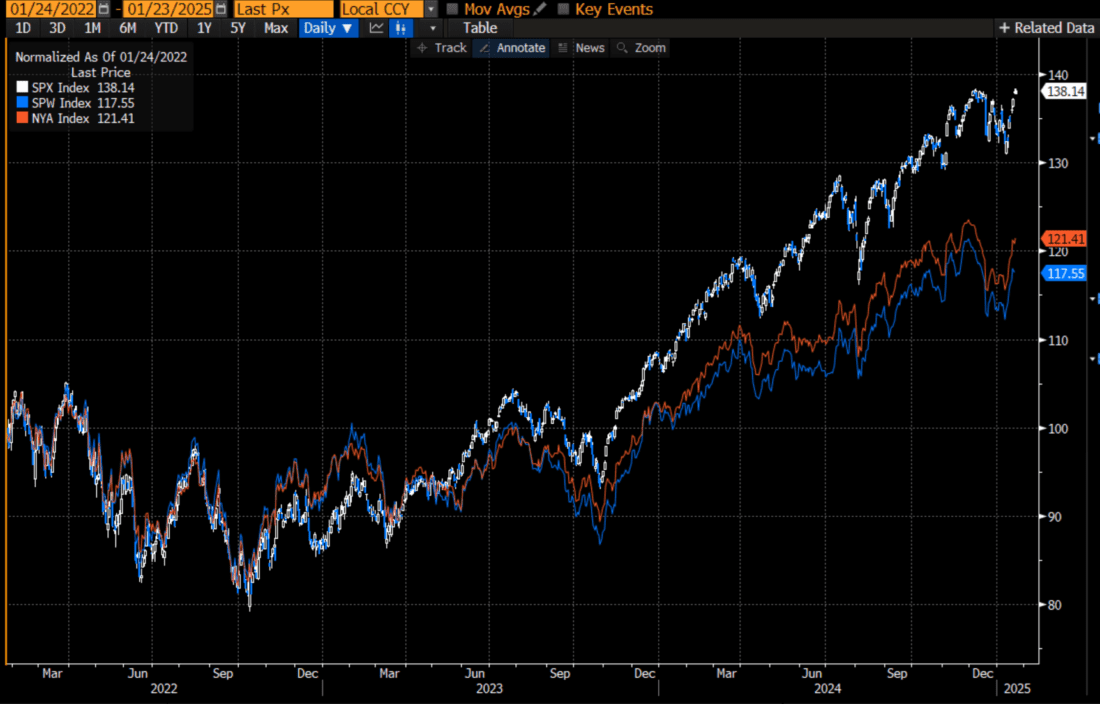
Source: Bloomberg
Past performance is not indicative of future results
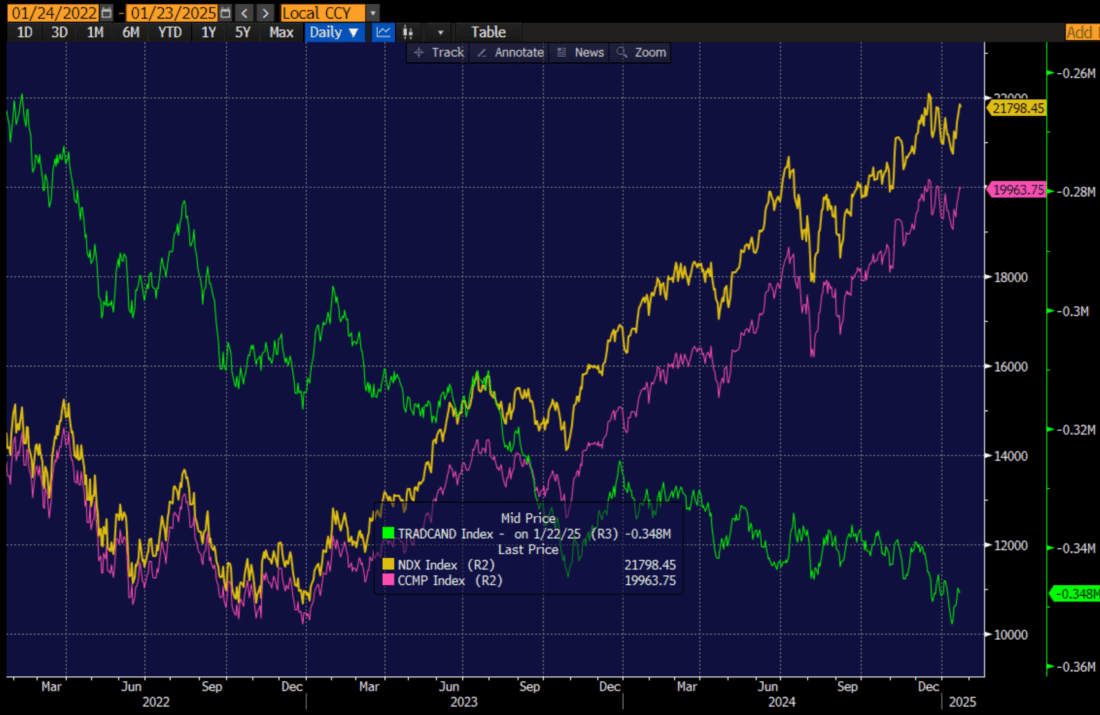
Interestingly, when we compare the Nasdaq 100 (NDX) to the Nasdaq Composite (CCMP), the performance gap is far narrower. Part of the reason for CCMP’s better tracking vs. NDX as opposed to NYA’s tracking vs. SPX is because the megacap technology that are dominating that index are all Nasdaq listed:
3-Years, NDX (purple), CCMP (yellow)
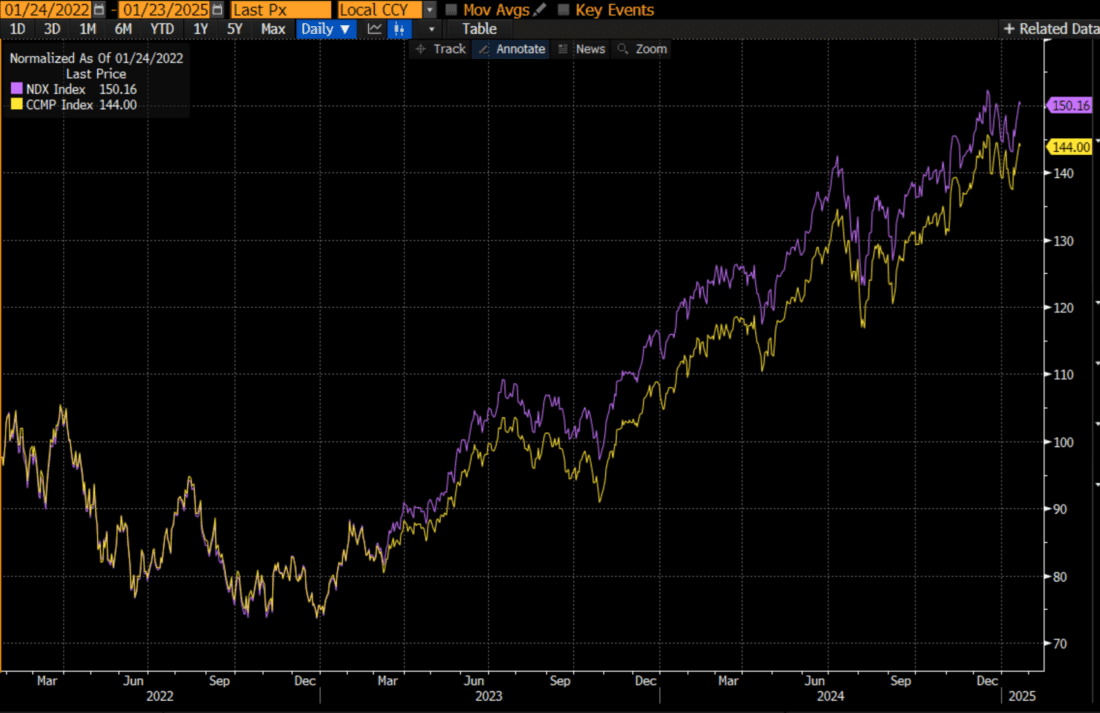
Source: Bloomberg
Past performance is not indicative of future results
Within the indices some advance-decline lines are keeping up with their benchmarks much better than others. For example, when we compare SPX to its cumulative advance-declines, we see that while the latest rally is not quite confirmed by the A/D line, it is not that far off. This comes, mind you, after a period in December when we went weeks with SPX decliners outpacing advancers, even as the index rose:
3-Years, SPX (blue), Cumulative SPX Advances-Declines (white)
Source: Bloomberg
Past performance is not indicative of future results
We see something similar with NYA and the NYSE cumulative A/D line:
3-Years, NYA (orange), NYSE A/D line (red)
Source: Bloomberg
Past performance is not indicative of future results
Yet by the same measure, both NDX and CCMP fall far short. The Nasdaq cumulative A/D line has seemingly been in freefall even as the indices soar. That said, this has been occurring for years with few ill effects, if any:
3-Years, NDX (yellow), CCMP (magenta), Nasdaq Cumulative A/D (green)
Source: Bloomberg
Past performance is not indicative of future results
Bottom line: for the most part, breadth has been keeping up with major indices. Certainly, there is underperformance when we compare SPW to SPX, and the drop in the Nasdaq A/D line is quite staggering, but on the whole, these should not be cause for immediate concern. Yet we have seen some index dips when the A/D lines fail to confirm new highs. It bears watching but not panic.
Disclosure: Interactive Brokers
The analysis in this material is provided for information only and is not and should not be construed as an offer to sell or the solicitation of an offer to buy any security. To the extent that this material discusses general market activity, industry or sector trends or other broad-based economic or political conditions, it should not be construed as research or investment advice. To the extent that it includes references to specific securities, commodities, currencies, or other instruments, those references do not constitute a recommendation by IBKR to buy, sell or hold such investments. This material does not and is not intended to take into account the particular financial conditions, investment objectives or requirements of individual customers. Before acting on this material, you should consider whether it is suitable for your particular circumstances and, as necessary, seek professional advice.
The views and opinions expressed herein are those of the author and do not necessarily reflect the views of Interactive Brokers, its affiliates, or its employees.
Disclosure: ETFs
Any discussion or mention of an ETF is not to be construed as recommendation, promotion or solicitation. All investors should review and consider associated investment risks, charges and expenses of the investment company or fund prior to investing. Before acting on this material, you should consider whether it is suitable for your particular circumstances and, as necessary, seek professional advice.
Disclosure: Futures Trading
Futures are not suitable for all investors. The amount you may lose may be greater than your initial investment. Before trading futures, please read the CFTC Risk Disclosure. A copy and additional information are available at the Warnings and Disclosures section of your local Interactive Brokers website.


Join The Conversation
If you have a general question, it may already be covered in our FAQs page. go to: IBKR Ireland FAQs or IBKR U.K. FAQs. If you have an account-specific question or concern, please reach out to Client Services: IBKR Ireland or IBKR U.K..
Visit IBKR U.K. Open an IBKR U.K. Account