


Markets were indecisive this morning on “Liberation Eve” as Wall Street geared up for Trump tariffs, but positive performance eventually ensued. Stocks had shifted from gains to losses several times this session, reflecting this hesitation, but the sharpest drawdown so far occurred 30 minutes after the bell when a pair of weaker-than-expected economic reports hit the tape. The accelerator of intraday selling was the ISM depicting the first contraction in manufacturing activity of the year amidst the highest prices paid figure in 33 months, worrying economists of weak demand alongside elevated inflation. Meanwhile, JOLTS, released simultaneously, reflected softening labor conditions while also arriving beneath projections. The combination of Trump jitters, recession worries and downside misses on the stateside calendar is sending rate watchers towards the long end of the curve, causing it to shift in bull-flattening fashion as traders lock in the yields of today.
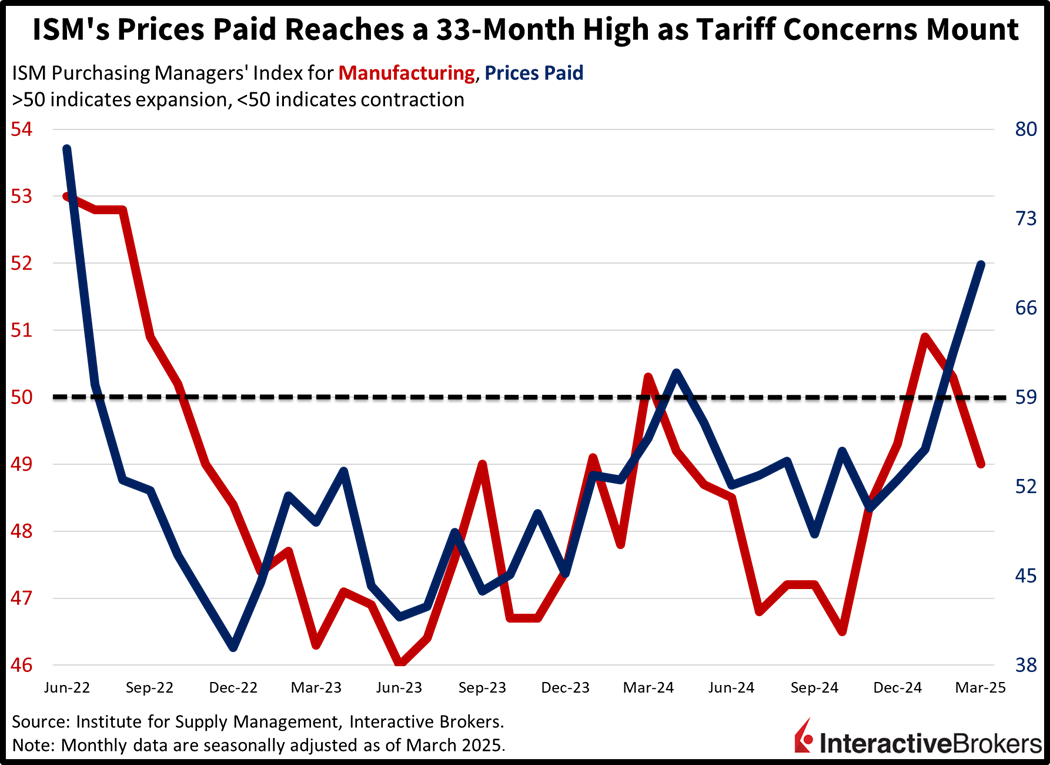
US Manufacturing Environment Weakens
Manufacturing conditions declined last month for the first time this year, as optimism related to the goods-producing sector has waned in light of an increasingly fragile consumer, trade uncertainty and cost pressures. The Institute for Supply Management’s Purchasing Managers’ Index for manufacturing dropped below the expansion-contraction threshold of 50 to 49, missing the median estimate of 49.5 and the previous month’s 50.3. Broad weakness was evident in the print, with employment, new orders, and production sinking to 44.7, 45.2 and 48.3 from 47.6, 48.6 and 50.7. But the prices component jumped to nearly a 3-year high of 69.4, jumping from 62.4 in February. Charges rose to the heaviest level since June of 2022.
Past performance is not indicative of future results
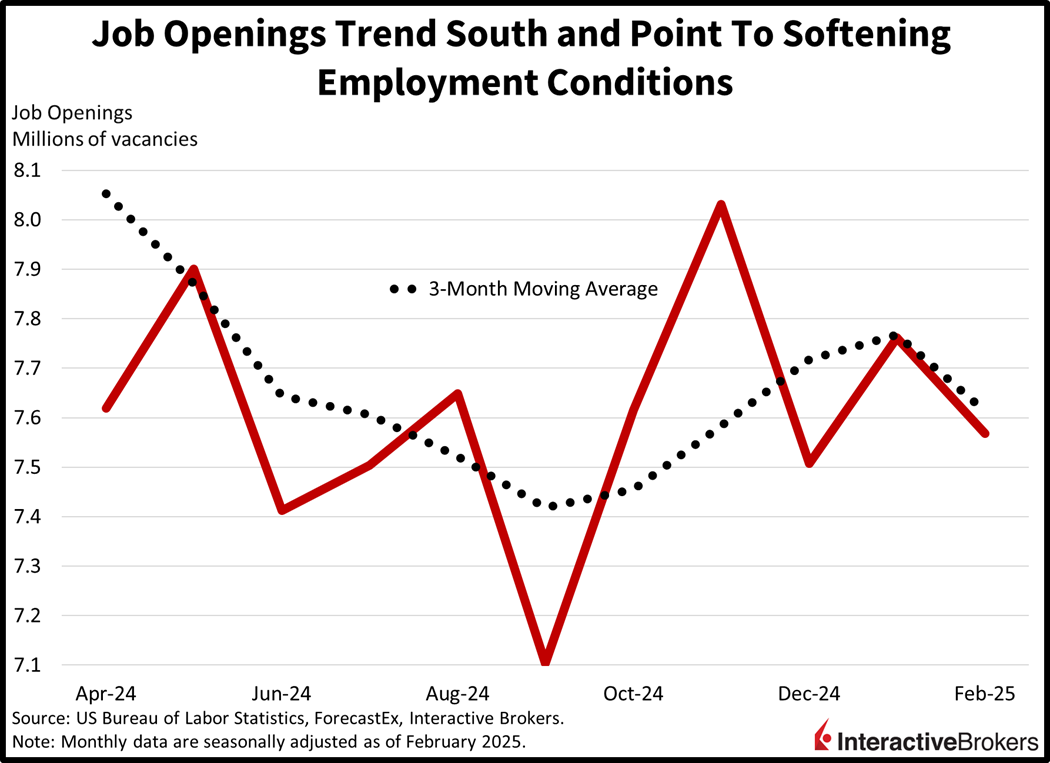
Job Market Softens
For hire signs and levels of quits declined in February, according to this morning’s Job Openings and Labor Turnover Survey (JOLTS). Job openings decreased to 7.568 million, lower than the projected 7.630 million and the 7.762 million from January. Quits fell from 3.256 million to 3.195 million during the period. The data, taken together, indicate softening employment conditions as less of a corporate appetite for workers coincides with reduced confidence that employees can replace their employers. Higher frequency numbers from Indeed suggest that the deceleration persisted last month.
Past performance is not indicative of future results
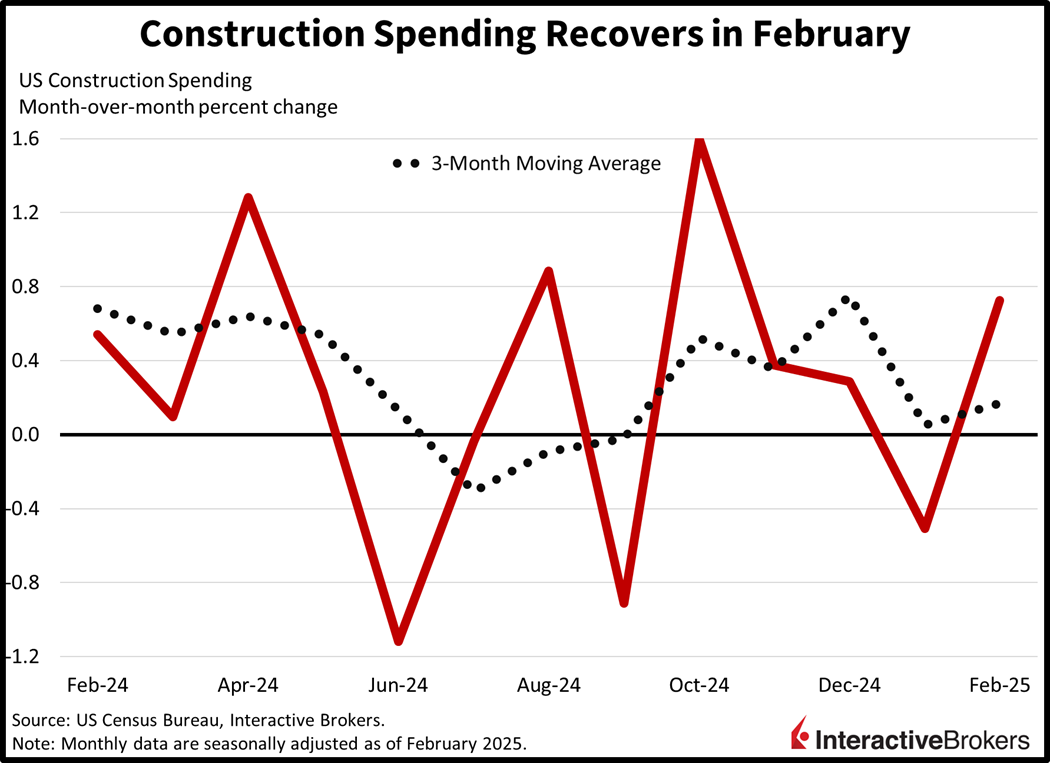
Construction Recovers
Construction spending for the month of February surprised to the upside, but the market impact of the report was far less than ISM and JOLTS. Outlays rose 0.7% month over month (m/m), exceeding the expectation of 0.3% and January’s 0.5% decline. A sharp recovery in single-family investments helped to drive the beat, with the residential category rising 1.3% m/m. Other components contributing to the gain were the smaller religion and conservation/development areas, which saw expenditures increase 4.2% and 2.3% during the period. Conversely, dollars for projects related to public safety, transportation and sewage declined 1.3%, 0.7% and 0.7%.
Past performance is not indicative of future results
Buy The Dip Rally
All major equity benchmarks are deeply in the green with the Nasdaq 100, Russell 2000, S&P 500 and Dow Jones Industrial gauges gaining by 0.9%, 0.7%, 0.5% and 0.3%. Every sector is up minus health care, which is down by 0.8%. Out of the 10 advancing segments, consumer discretionary, industrials and technology are leading; they’re climbing 1.5%, 0.4% and 0.4%. Treasurys are also catching fierce bids with the 2- and 10-year maturities changing hands at 3.86% and 4.15%, 2 and 6 basis points (bps) lighter on the session in bull-flattening fashion. Lower borrowing charges and weak economic data are weighing on the greenback, however, and its index is losing 6 bps as the US currency depreciates relative to most of its major counterparts, including the pound sterling, franc, yen, loonie and Aussie tender. It is appreciating versus the euro and yuan though. Commodities are mixed with silver and copper trading south by 1.3% and 0.2%, but crude oil, lumber and gold have moved higher by 0.2%. The interest in crude oil is motivated by Washington potentially firming up its sanction policy against Tehran and Moscow while lumber’s positivity is being driven by the upside beat in construction spending as well as softer mortgages rates.
Stock Bulls Are Looking for April Fools on Tariffs
With the nervousness on Wall Street about a potential recession driving stocks and rates south year to date, a better than feared announcement tomorrow can certainly drive animal spirits and growth prospects north. While the Trump administration has operated under a short-term pain, long-term gain framework, pressures in markets and the economy may compel the Commander in Chief to acquiesce towards leniency for the time being. But on the contrary, an unwavering message illustrating heightened ambitions may deliver further losses in equities amidst high and rising uncertainty levels. Heavy fogs have already weakened investor sentiment, capital expenditure initiatives, consumer spending momentum and valuation multiples. The murkiness and lethargy are likely to persist absent a substantial increase in visibility.
International Roundup
Europe Inflation Moves Closer to Target
Euro area inflation rose 0.6% m/m and 2.2% year over year in March, according to the preliminary Harmonised Index of Consumer Prices (HICP) released today by Eurostat. The 12-month result met the analyst expectation and eased from 2.3% in February while the m/m metric increased from 0.4%. The core CPI, which excludes items with more volatile charges such as energy, alcohol, tobacco and food, climbed 2.4% y/y, down from 2.6% in the second month of 2025 and below the median estimate of 2.5%.
With the headline y/y figure moving closer to the European Central Banks 2% target, economists are expecting that the monetary policy authority will trim its key interest rate at its April 16 meeting. Against that backdrop, the European Union estimates that the anticipated retaliatory tariffs by its member countries could add a half a percentage point to annualized cost pressures.
Singapore Home Prices Stabilize
Values for Singapore’s private residential properties increased at a slower pace last quarter, climbing only 0.6% during the first three months of this year and gaining 2.30% in the preceding period, according to preliminary data from the Urban Redevelopment Authority. For full-year 2024, prices rose 2.9%. The Singapore government is working to improve housing supply and expects to release 5,030 homes after the first half of this year following its government land sale.
UK Home Prices Climb as Tax Holiday Ends
Home prices in the UK climbed 3.9% y/y last month, matching February’s pace and were unchanged m/m, according to the Nationwide HPI benchmark. Analysts anticipated a m/m increase of 0.2% following February’s 0.4% jump. Locations north of England experienced the largest price growth while the lowest six performing markets were to the south. March marked the end of a holiday on real estate transaction taxes.
China Manufacturing Stronger Than Expected
The China Caixin manufacturing Purchasing Managers Index climbed to 51.2 in March, up from 50.8 in February. While various Asian countries have experienced declining PMI results after exporters frontloaded shipments prior to the implementation of US tariffs, China’s score hit its highest level in four months. Companies reported increases in orders, including from export markets.
New to Interactive Brokers?
Open AccountDisclosure: Interactive Brokers Affiliate
Information posted on IBKR Campus that is provided by third-parties does NOT constitute a recommendation that you should contract for the services of that third party. Third-party participants who contribute to IBKR Campus are independent of Interactive Brokers and Interactive Brokers does not make any representations or warranties concerning the services offered, their past or future performance, or the accuracy of the information provided by the third party. Past performance is no guarantee of future results.
This material is from IBKR Macroeconomics, an affiliate of Interactive Brokers LLC, and is being posted with its permission. The views expressed in this material are solely those of the author and/or IBKR Macroeconomics and Interactive Brokers is not endorsing or recommending any investment or trading discussed in the material. This material is not and should not be construed as an offer to buy or sell any security. It should not be construed as research or investment advice or a recommendation to buy, sell or hold any security or commodity. This material does not and is not intended to take into account the particular financial conditions, investment objectives or requirements of individual customers. Before acting on this material, you should consider whether it is suitable for your particular circumstances and, as necessary, seek professional advice.
Disclosure: Futures Trading
Futures are not suitable for all investors. The amount you may lose may be greater than your initial investment. Before trading futures, please read the CFTC Risk Disclosure. A copy and additional information are available at the Warnings and Disclosures section of your local Interactive Brokers website.
Disclosure: Bonds
As with all investments, your capital is at risk.


Join The Conversation
If you have a general question, it may already be covered in our FAQs page. go to: IBKR Ireland FAQs or IBKR U.K. FAQs. If you have an account-specific question or concern, please reach out to Client Services: IBKR Ireland or IBKR U.K..
Visit IBKR U.K. Open an IBKR U.K. Account