


I expected to write today about President Trump’s speech to Congress last night, but frankly, despite its length, there was a dearth of market-moving topics. For better or worse, the market itself is rife with topics worth discussion, with some interesting patterns arising in key investments.
One topic of conversation has been the recent underperformance of banks. While markets as a whole have been performing poorly, financial stocks have done even worse. Compare the relative performances of the S&P 500 (SPX) with KRE (the S&P Regional Banking ETF); XLF, (the Financial Select Sector SPDR); the KBW Bank Index (BKX) over the past week:
1-Week Chart, KRE (red/green candles), SPX (yellow), BKX (blue), XLF (purple)
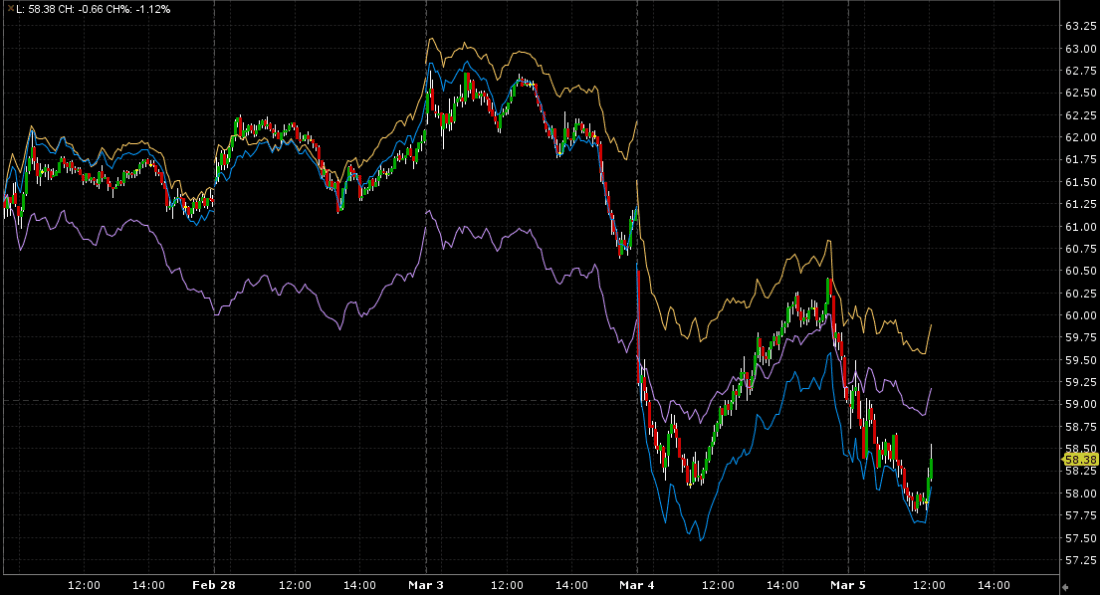
Source: Interactive Brokers – Past performance is not indicative of future results
Over the post-election period, we see that there was early enthusiasm for the banking sector, but that has since faded:
4-Month Chart, KRE (red/green candles), SPX (yellow), BKX (blue), XLF (purple)
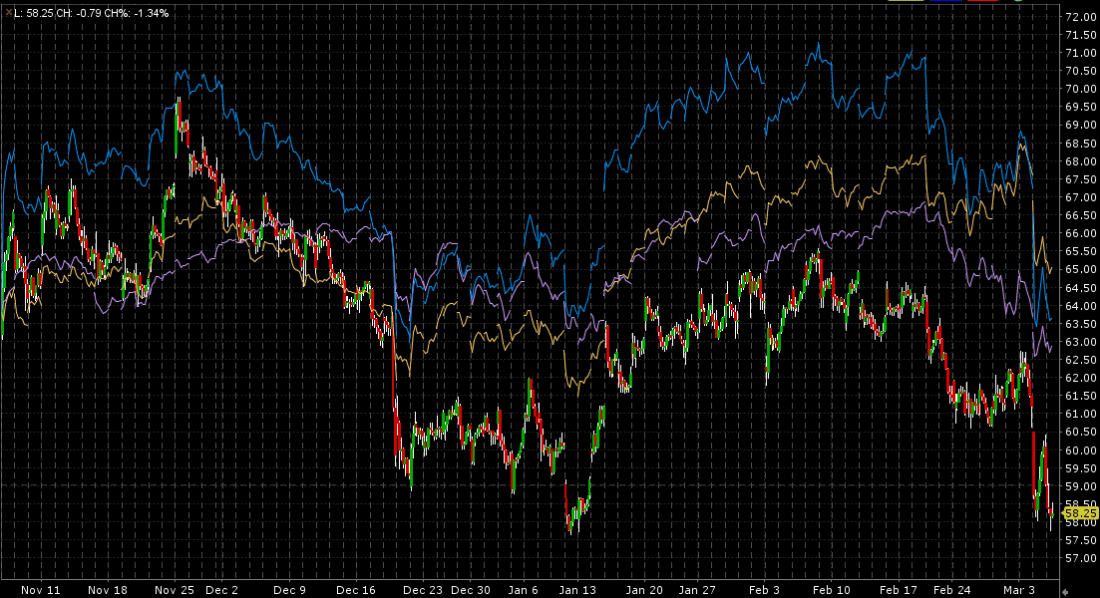
Source: Interactive Brokers – Past performance is not indicative of future results
The reason for the early enthusiasm was quite understandable. Much of the overall stock market rally was based upon hopes for lighter regulation and less scrutiny for mergers and acquisitions. As a heavily regulated industry, the banking sector would undoubtedly benefit. Regional banks initially rose most, since they would be the likely acquirees in an easier M&A climate, though that enthusiasm faded. As of now, we have heard few specifics about bank regulation and merger scrutiny, so it is understandable why some investors got impatient.
But the most recent plunge might have been precipitated by something more specific – the inverted yield curve is back! Three-month Treasury bills are now yielding more than 10-year notes, though the 2-10 portion of the curve remains normally upward sloping:
Yield Spreads Since 1985, 2-10 (white), 3mo-10-year (blue); with NBER Recession Starts (red) and Ends (green)
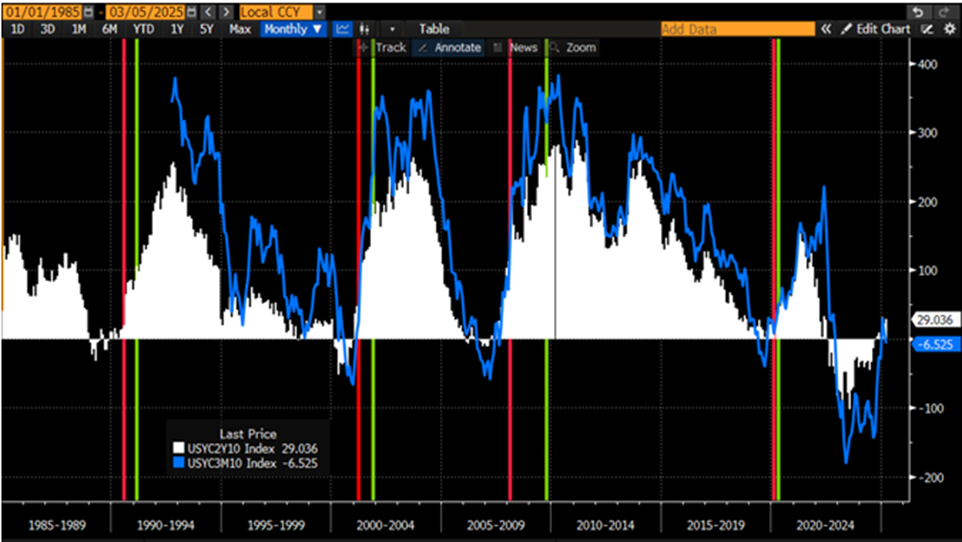
Sources: Bloomberg, Interactive Brokers – Past performance is not indicative of future results
Remember, inverted yield curves are bad news for bankers. In general, banks are in the business of borrowing in the short-term, through customer deposits and/or money markets, and lending long-term via business loans and/or mortgages. Thus, their relative cost of funding has increased.
And the reason for that increase is unpleasant. We have noted that Fed Funds futures are now pricing in 3 rate cuts for 2025, which is up from the expectations for only 1 cut that prevailed just a few weeks ago. Economic expectations have retreated sharply, exacerbated by yesterday’s tariff implementation. That’s a nasty combination for bankers. Their net cost of funding has remained stable even as the yields on potential loans have declined, while at the same time, weaker economic prospects do nothing positive for their customers’ creditworthiness. No wonder why those stocks suffered.
And speaking of inversions, though in a different context, we should also note that the VIX futures curve has inverted too. It was normal two weeks ago, flipped to a minor inversion last week, and is notably inverted now.
VIX Futures Term Structure, Today (yellow), 1-week ago (red), 2-weeks ago (green)
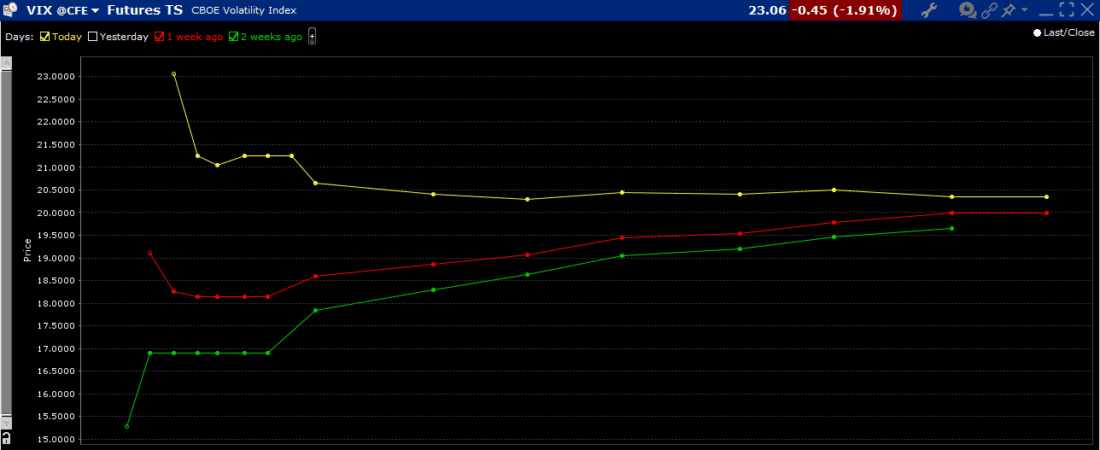
Source: Interactive Brokers – Past performance is not indicative of future results
Some of the short-term spike could be related to concerns about Friday’s jobs report, but it is not just nerves that are boosting VIX. Correlations are higher – as they typically are during rocky markets – and thus VIX is priced around levels that have prevailed when correlations (as measured by the Cboe’s COR1M index) are at the current value:
1-Year Chart VIX (red/green daily candles), COR1M (blue line)
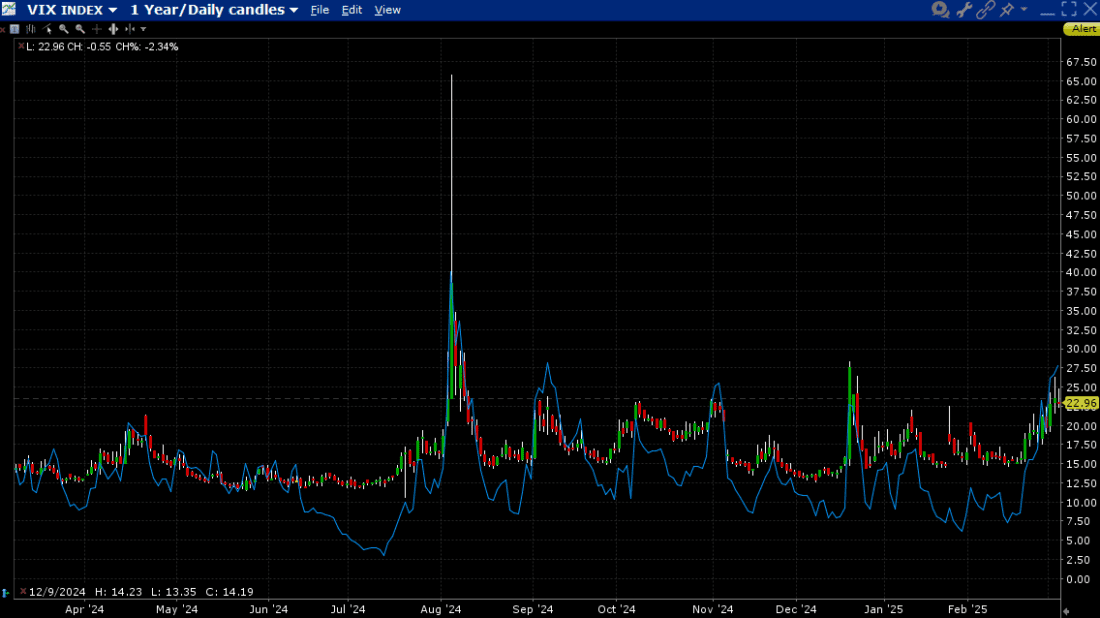
Source: Interactive Brokers – Past performance is not indicative of future results
Thus, while it might be tempting to note that the VIX curve inversion denotes a disproportionate amount of fear in the short-term, there is a clear relationship to overriding exogenous factors. As I noted yesterday during a media appearance, the current levels of VIX, while relatively elevated, are pricing in a bit less than 1.5% daily moves. Does that seem unreasonable in this current environment of macro uncertainty? That should be the key influence on your decisions regarding the future path of volatility.
Disclosure: Interactive Brokers
The analysis in this material is provided for information only and is not and should not be construed as an offer to sell or the solicitation of an offer to buy any security. To the extent that this material discusses general market activity, industry or sector trends or other broad-based economic or political conditions, it should not be construed as research or investment advice. To the extent that it includes references to specific securities, commodities, currencies, or other instruments, those references do not constitute a recommendation by IBKR to buy, sell or hold such investments. This material does not and is not intended to take into account the particular financial conditions, investment objectives or requirements of individual customers. Before acting on this material, you should consider whether it is suitable for your particular circumstances and, as necessary, seek professional advice.
The views and opinions expressed herein are those of the author and do not necessarily reflect the views of Interactive Brokers, its affiliates, or its employees.
Disclosure: Bonds
As with all investments, your capital is at risk.
Disclosure: Futures Trading
Futures are not suitable for all investors. The amount you may lose may be greater than your initial investment. Before trading futures, please read the CFTC Risk Disclosure. A copy and additional information are available at the Warnings and Disclosures section of your local Interactive Brokers website.
Disclosure: ETFs
Any discussion or mention of an ETF is not to be construed as recommendation, promotion or solicitation. All investors should review and consider associated investment risks, charges and expenses of the investment company or fund prior to investing. Before acting on this material, you should consider whether it is suitable for your particular circumstances and, as necessary, seek professional advice.


Join The Conversation
If you have a general question, it may already be covered in our FAQs page. go to: IBKR Ireland FAQs or IBKR U.K. FAQs. If you have an account-specific question or concern, please reach out to Client Services: IBKR Ireland or IBKR U.K..
Visit IBKR U.K. Open an IBKR U.K. Account