


1/ They Came, They Saw, and They Left!
2/ What Are These Two Saying?
3/ Is it Time for a Secular Change?
Investopedia is partnering with CMT Association on this newsletter. The contents of this newsletter are for informational and educational purposes only, however, and do not constitute investing advice. The guest authors, which may sell research to investors, and may trade or hold positions in securities mentioned herein do not represent the views of CMT Association or Investopedia. Please consult a financial advisor for investment recommendations and services.
1/
They Came, They Saw, and They Left!
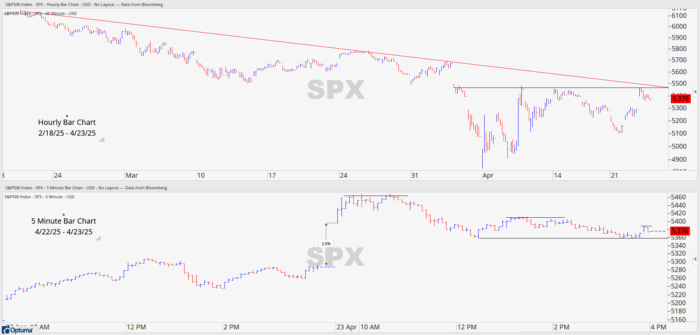
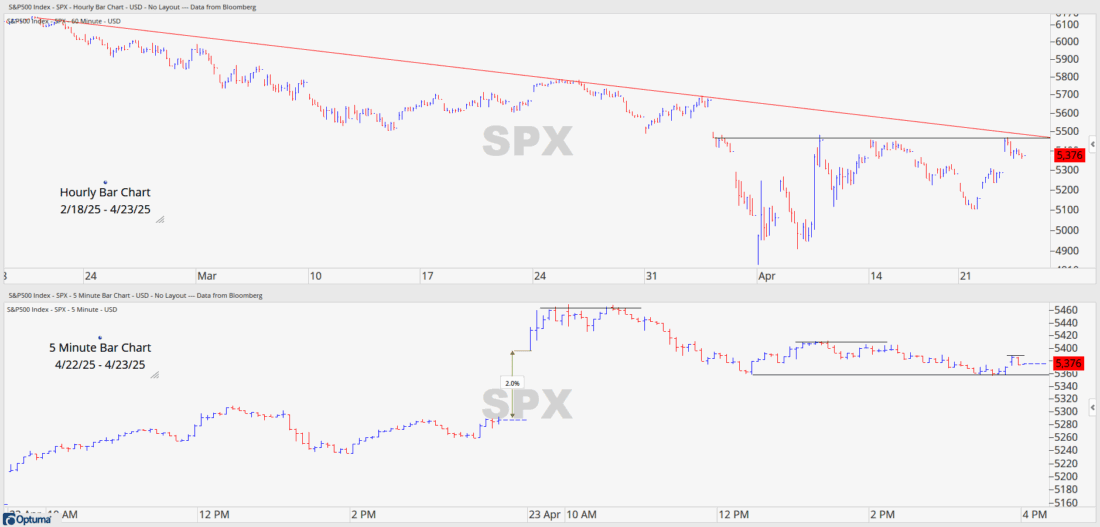
Today’s market rally was a welcome relief for investors, as the S&P 500 ended the day up 1.67%. It was a good day in the market, especially considering the ongoing tariff concerns that dominate the headlines. While we can debate about whether the Treasury Secretary’s comments on finding a way to de-escalate China’s tariffs or the President’s remarks on the Fed Chair triggered the rally, what caught my attention was the market’s sell off upon the rebound. After a strong bounce from yesterday’s close, the market gapped up by approximately 2% to 5,420. It continued to rise for the first hour, peaking up 3.4% around the 5,460 level. However, the market encountered price resistance at the same post-tariff announcement levels as before, and near the down trend line from the highs earlier in the year. From there, the market experienced lower highs followed by lower lows, a classic sign of investors selling after capitalizing on the bounce and moving to the sidelines. While one bright spot was the S&P 500 holding the 5,360 level throughout the day, more work needs to be done to get it moving in the right direction again.
Past performance is not indicative of future results
2/
What Are These Two Saying?
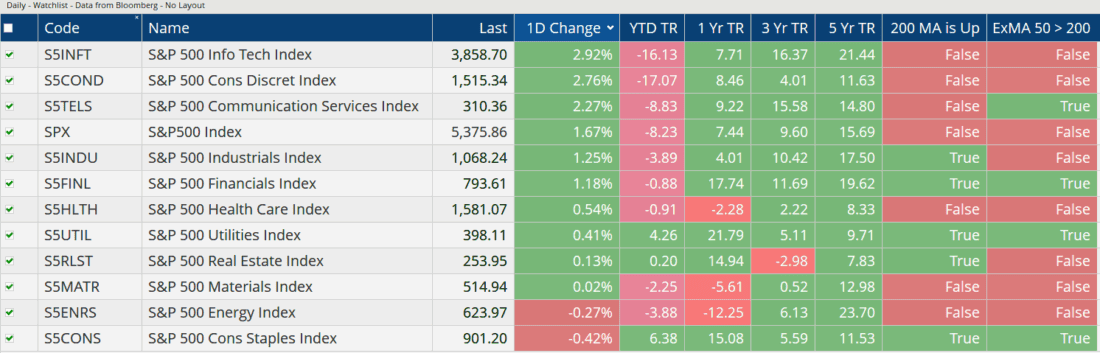
Nine out of the eleven sectors of the S&P 500 rose yesterday, while the two that fell are an unusual pair. The Consumer Staples sector has outperformed the S&P 500 year-to-date, one of the few sectors with a positive return for the year, up 6.38%. Investors have found refuge in this sector as recession concerns have crept into the markets. This makes sense, as cyclical sectors of the economy will struggle during an economic downturn, while the Staples sector remains reliable as we all still need our essential items. However, the Staples sector fell -0.4% yesterday, indicating money rotating from its YTD winning status, to the more cyclical and beaten down sectors of the market. Information Technology and Consumer Discretionary sectors led the rally, rising by 2.92% and 2.76%, respectively. Other cyclical sectors, including Communication Services, Industrials, and Financials, also performed well, rounding out the top five best performers. Notably, the Energy sector and its -0.27% decline yesterday, continues to exhibit signs of recession worries. Sector analysts can provide valuable insights into the overall market health, and the Energy sector’s persistent issues suggest that the market has yet to gain its footing. The unusual pairing of Staples and Energy’s downfall yesterday further hints at the market’s uncertainty and the need for more time and the wisdom of price to signal the all clear.
Past performance is not indicative of future results
3/
Is it Time for a Secular Change?
When I began my career in the financial industry in the early 2000s after college, the investing landscape was vastly different. Emerging markets and commodities like gold and oil were the focus of investors. Emerging from the Tech bubble of 2001, the investment world gravitated towards hard assets and new growth fueled by China’s new WTO membership. After the Great Financial Crisis, investor focus shifted back to technology, and the US experienced one of its most dominant secular runs compared to the rest of the world. As the FANGs gave way to the MAG 7 and artificial intelligence, the US’s secular outperformance remained unwavering.
Past performance is not indicative of future results
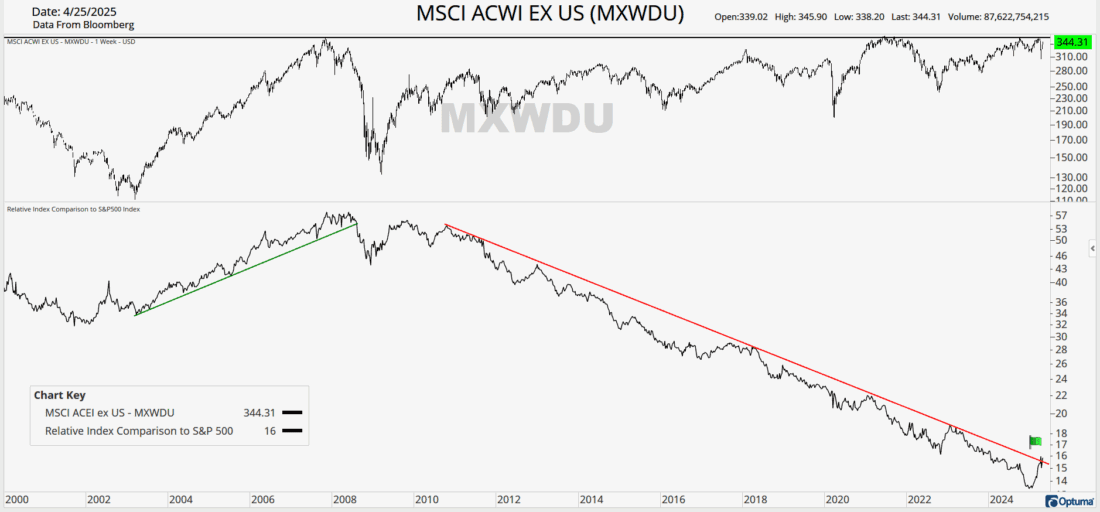
However, we are now witnessing signs of change. As the US dollar falls below its two-year low and US valuations remain stretched, the rest of the world is gaining momentum. While selling the MSCI All Country World ex US and buying the S&P 500 has been an exceptional pair trade for the past 15 years, this secular run may finally be coming to an end. The ACWI ex US appears to be breaking out from its prolonged downward trend against the S&P on its relative strength (RIC) chart, and the price chart shows it approaching all-time high resistance. A breakout on price above these levels would be further confirmation of the relative strength chart. We could be witnessing the beginning of a new secular regime where the rest of the world outperforms the US for a substantial period of time. Who knows, maybe commodities will even be in vogue again, does gold hitting new all-time highs sound familiar? Time will tell.
—
Originally posted 24th April 2025


Join The Conversation
If you have a general question, it may already be covered in our FAQs page. go to: IBKR Ireland FAQs or IBKR U.K. FAQs. If you have an account-specific question or concern, please reach out to Client Services: IBKR Ireland or IBKR U.K..
Visit IBKR U.K. Open an IBKR U.K. Account