


Relatively Strong Despite Fear
Investopedia is partnering with CMT Association on this newsletter. The contents of this newsletter are for informational and educational purposes only, however, and do not constitute investing advice. The guest authors, which may sell research to investors, and may trade or hold positions in securities mentioned herein do not represent the views of CMT Association or Investopedia. Please consult a financial advisor for investment recommendations and services.
Relatively Strong Despite Fear
To start this week’s “5-days of Chartmas,” investors continue to be fearful, with no shortage of pundits calling for a market top. Whether it’s technology, A.I., or the S&P500, I keep hearing new stories about how bad things are going to get.
Most professionals understand that sentiment is inversely correlated with investment performance, and if you google “CNN Fear Greed,” you’ll likely find a link to this image (below) at the top of your search results:
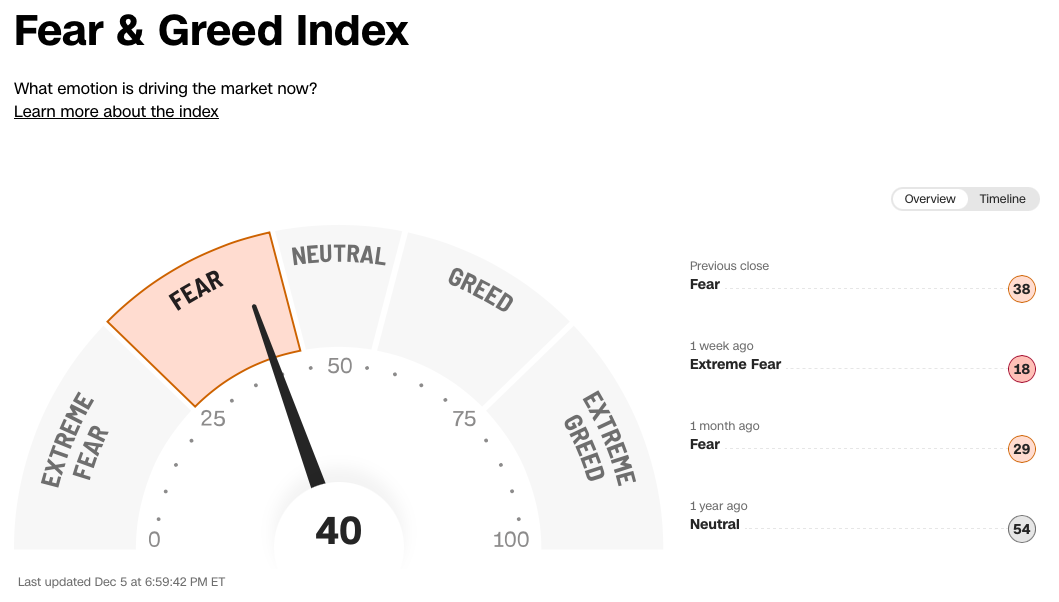
However, high levels of fear in the market do not historically produce high probabilities of market tops.
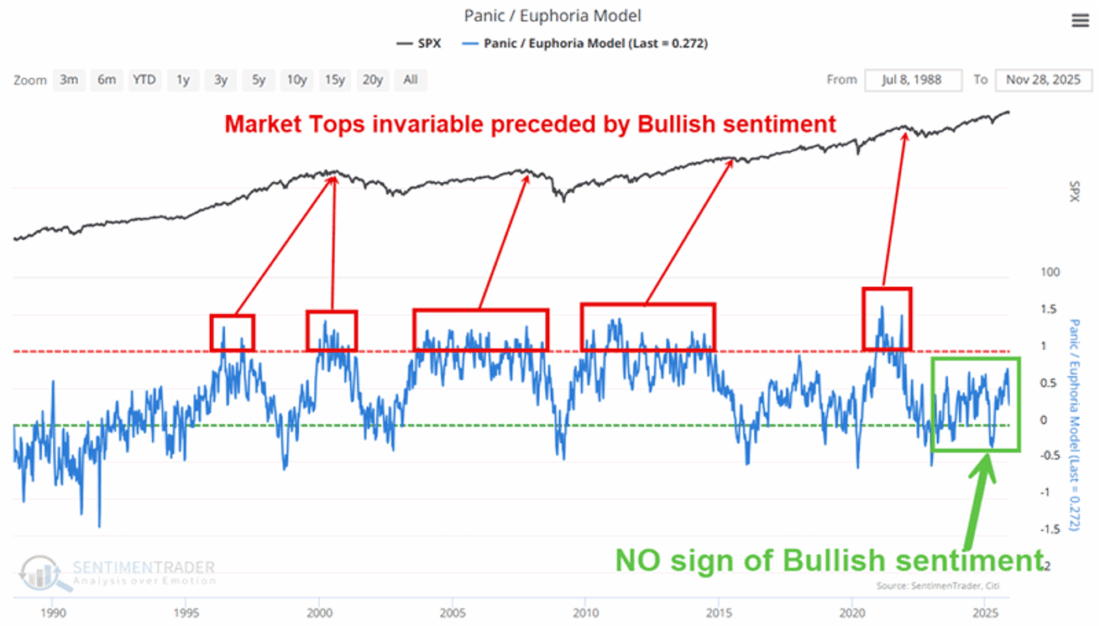
Take, for instance, this chart (below) published by SentimenTrader, where in the top pane, you have the S&P500 and in the bottom pane, their “Panic / Euphoria” model. This chart goes all the way back to 1990, and major market tops have only occurred after peaks above 1.0.
Furthermore, there were times like the late-90s, or during most of the market rebound from 2003-2007 or 2009-2015 when the model was consistently elevated and the market just wouldn’t crash.
Today, we’re just not seeing this kind of elevated bullish sentiment…
Past performance is not indicative of future results.
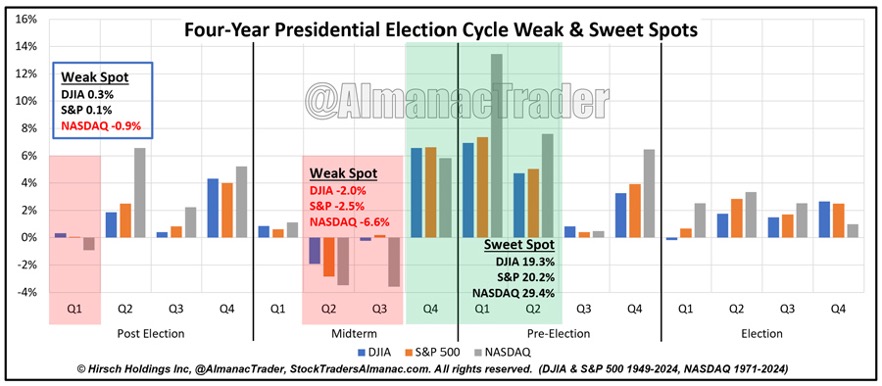
Finally, aside from the fact that the stock market continues to rise, despite all the negativity and doom & gloom, we’re still living in a relatively strong time period during the 4-year election cycle. The table below comes from The Stock Trader’s Almanac and as you can see, the month of December is the 2nd best month for the market during a post-election year.
It’s not until the second and third quarter of a midterm election year (which would be 2026, by the way) when things historically start to struggle… but, the next three quarters thereafter are typically the strongest period fo time during the entire cycle.
Past performance is not indicative of future results.
Naturally, the only thing that matters is what actually happens, not what some historical statistics say, which is why using technical analysis, relative strength, and trend following can give you an edge when markets get volatile.
So stay tuned for more educational charts and tables, and the final four “Days of Chartmas,” throughout the remainder of this week!
—
Originally posted 8th December 2025
Disclosure: Investopedia
Investopedia.com: The comments, opinions and analyses expressed herein are for informational purposes only and should not be considered individual investment advice or recommendations to invest in any security or to adopt any investment strategy. While we believe the information provided herein is reliable, we do not warrant its accuracy or completeness. The views and strategies described on our content may not be suitable for all investors. Because market and economic conditions are subject to rapid change, all comments, opinions and analyses contained within our content are rendered as of the date of the posting and may change without notice. The material is not intended as a complete analysis of every material fact regarding any country, region, market, industry, investment or strategy. This information is intended for US residents only.
Disclosure: Interactive Brokers Third Party
Information posted on IBKR Campus that is provided by third-parties does NOT constitute a recommendation that you should contract for the services of that third party. Third-party participants who contribute to IBKR Campus are independent of Interactive Brokers and Interactive Brokers does not make any representations or warranties concerning the services offered, their past or future performance, or the accuracy of the information provided by the third party. Past performance is no guarantee of future results.
This material is from Investopedia and is being posted with its permission. The views expressed in this material are solely those of the author and/or Investopedia and Interactive Brokers is not endorsing or recommending any investment or trading discussed in the material. This material is not and should not be construed as an offer to buy or sell any security. It should not be construed as research or investment advice or a recommendation to buy, sell or hold any security or commodity. This material does not and is not intended to take into account the particular financial conditions, investment objectives or requirements of individual customers. Before acting on this material, you should consider whether it is suitable for your particular circumstances and, as necessary, seek professional advice.


Join The Conversation
If you have a general question, it may already be covered in our FAQs page. go to: IBKR Ireland FAQs or IBKR U.K. FAQs. If you have an account-specific question or concern, please reach out to Client Services: IBKR Ireland or IBKR U.K..
Visit IBKR U.K. Open an IBKR U.K. Account