


 The Language of Options and Payout Diagrams (Dutch)")

 Options in Financial Markets (Dutch)")


By Todd Stankiewicz CMT, CFP, ChFC
1/ The S&P 500 Holds the Line, For Now
2/ Nvidia Cling to Key Support
Investopedia is partnering with CMT Association on this newsletter. The contents of this newsletter are for informational and educational purposes only, however, and do not constitute investing advice. The guest authors, which may sell research to investors, and may trade or hold positions in securities mentioned herein do not represent the views of CMT Association or Investopedia. Please consult a financial advisor for investment recommendations and services.
1/
The S&P 500 Holds the Line, For Now
Past performance is not indicative of future results
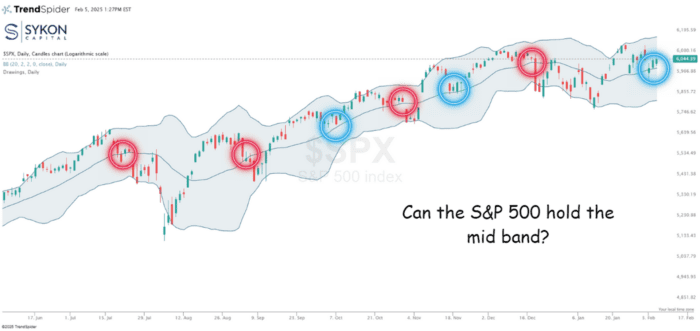
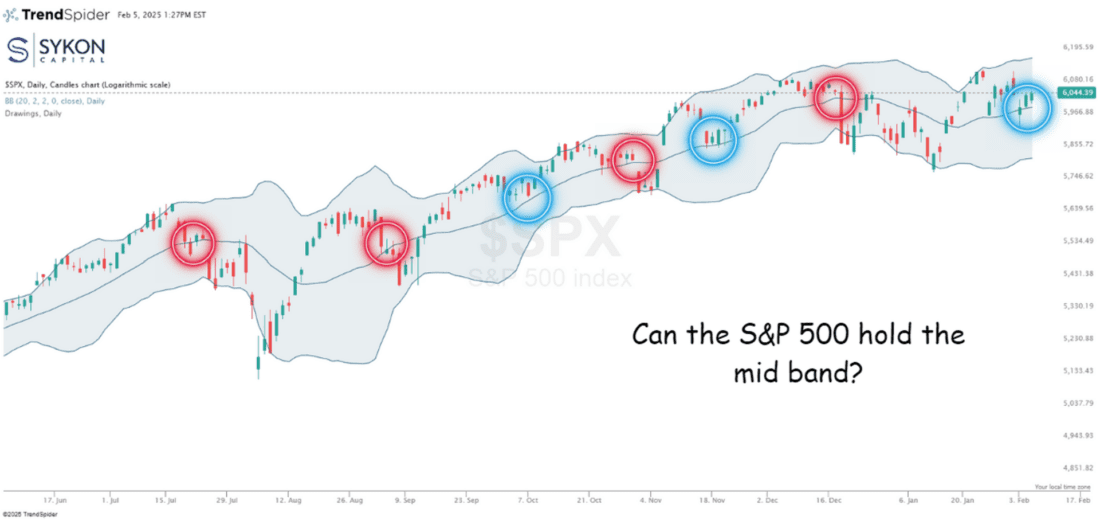
The S&P 500 threatened to break below the middle Bollinger Band on Monday’s gap down but managed to recover with a strong intraday reversal. Even in yesterday’s stronger session, the index bounced right off that middle band intraday, a clear sign that this level is acting as key support.
Historically, when the S&P 500 drops below the middle band, it often gravitates toward the lower band. Right now, that puts key levels at 5,994 (middle band) and 5,819 (lower band).
For now, patience may be warranted as long as the index holds above this critical threshold. A sustained break below could open the door for a deeper move.
2/
Nvidia Cling to Key Support
Past performance is not indicative of future results
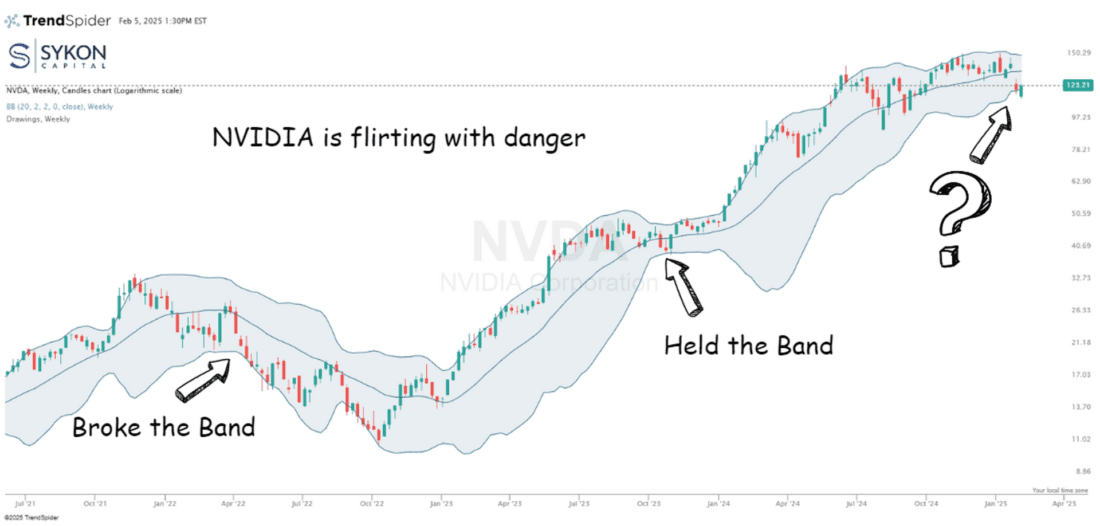
Like the S&P 500, NVIDIA is battling to hold a critical technical level. However, in this case, it’s sitting right on the lower Bollinger Band on the weekly chart.
NVDA opened this week below that level but has since rallied back above it, reclaiming key support. Historically, a sustained break below this lower band at 120.50,it can lead to more significant downside moves, just as it did in 2022.
Back in Fall 2023, NVIDIA dipped below the middle Bollinger Band but managed to find support at the lower band, setting the stage for another rally. This time, holding the lower band will be crucial in avoiding further downside pressure.
If it holds, it could stabilize. If it breaks, the chart suggests more room to fall.
—
Originally posted 6th February 2025
Disclosure: Investopedia
Investopedia.com: The comments, opinions and analyses expressed herein are for informational purposes only and should not be considered individual investment advice or recommendations to invest in any security or to adopt any investment strategy. While we believe the information provided herein is reliable, we do not warrant its accuracy or completeness. The views and strategies described on our content may not be suitable for all investors. Because market and economic conditions are subject to rapid change, all comments, opinions and analyses contained within our content are rendered as of the date of the posting and may change without notice. The material is not intended as a complete analysis of every material fact regarding any country, region, market, industry, investment or strategy. This information is intended for US residents only.
Disclosure: Interactive Brokers Third Party
Information posted on IBKR Campus that is provided by third-parties does NOT constitute a recommendation that you should contract for the services of that third party. Third-party participants who contribute to IBKR Campus are independent of Interactive Brokers and Interactive Brokers does not make any representations or warranties concerning the services offered, their past or future performance, or the accuracy of the information provided by the third party. Past performance is no guarantee of future results.
This material is from Investopedia and is being posted with its permission. The views expressed in this material are solely those of the author and/or Investopedia and Interactive Brokers is not endorsing or recommending any investment or trading discussed in the material. This material is not and should not be construed as an offer to buy or sell any security. It should not be construed as research or investment advice or a recommendation to buy, sell or hold any security or commodity. This material does not and is not intended to take into account the particular financial conditions, investment objectives or requirements of individual customers. Before acting on this material, you should consider whether it is suitable for your particular circumstances and, as necessary, seek professional advice.
Disclosure: ETFs
Any discussion or mention of an ETF is not to be construed as recommendation, promotion or solicitation. All investors should review and consider associated investment risks, charges and expenses of the investment company or fund prior to investing. Before acting on this material, you should consider whether it is suitable for your particular circumstances and, as necessary, seek professional advice.
Disclosure: Futures Trading
Futures are not suitable for all investors. The amount you may lose may be greater than your initial investment. Before trading futures, please read the CFTC Risk Disclosure. A copy and additional information are available at the Warnings and Disclosures section of your local Interactive Brokers website.


")


Join The Conversation
If you have a general question, it may already be covered in our FAQs page. go to: IBKR Ireland FAQs or IBKR U.K. FAQs. If you have an account-specific question or concern, please reach out to Client Services: IBKR Ireland or IBKR U.K..
Visit IBKR U.K. Open an IBKR U.K. Account