


 The Language of Options and Payout Diagrams (Dutch)")

 Options in Financial Markets (Dutch)")


Investopedia is partnering with CMT Association on this newsletter. The contents of this newsletter are for informational and educational purposes only, however, and do not constitute investing advice. The guest authors, which may sell research to investors, and may trade or hold positions in securities mentioned herein do not represent the views of CMT Association or Investopedia. Please consult a financial advisor for investment recommendations and services.
1/
Fixed Income Futures
There is added text today in the US TREASURY FIXED INCOME FUTURES.
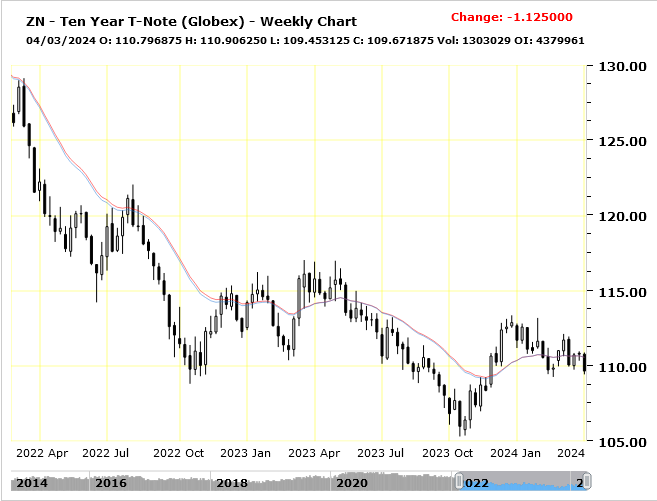
US TREASURY FIXED INCOME JULYFUTURES: trade is testing the 5-, 10-, and 30-Year Notes and Bond February and March lows/supports. A weekly close below the February 20 and March 18 lows in these three markets and prices will continue lower. Any up thrust in trading and supply to enter these markets will dictate market direction. We will alert you.
Most recently, on February 5th we stated that prices were rejected at the December 2023 highs and trade is presently approaching the January low supports. We also stated on February 5th that closing below these levels in the 5, 10, and 30 YR Futures and trade will continue lower. On February 13th we stated that the 30 YR is on the verge of closing below the January support, take note. Prices have continued lower as suggested.
We previously stated on January 2nd that supply is occurring in these markets and if prices close on a weekly basis below last week’s lows in these three markets lower prices should occur—in our January 8th PowerPlay, we noted that this action occurred on Friday January 5th.
2/
Charts


Past performance is not indicative of future results
3/
Defining Traps
The Beanpot Trap is a Proprietary Sentiment Indicator using a novel approach to Predictive Behavioral Analysis. The Market’s participant’s collective behavior is identified (proprietary supply and demand) which generates detectable behavioral patterns that are accurately forecasted for price direction. If you know why
a factor works you should know with high probability when the factor should work! Throughout the years, covered market highs and lows leading to Bull and Bear Cyclical and Secular markets have been called in the PowerPlay utilizing the Beanpot Trap.
Definition of a Trap: the trap usually occurs in a very oversold or overbought condition. The market that is highlighted in the PowerPlay should move higher for a few days or weeks in an oversold condition or moves lower for a few days or weeks in an overbought condition, while Proprietary Capital Flow– Supply/Sellers or Demand/Buyers enters the marketplace. Trade is always in great shape above this new demand in an uptrend or it is always in great shape below this new supply in a downtrend; however, if trade takes out the proprietary demand/buyers in an
uptrend or proprietary supply/sellers in a down trend, the structure of the markets have changed leading to profound negative outcomes to the existing trend. If the demand/buyers get taken out, a long squeeze (much lower prices) should follow and if the supply/sellers get taken out, a short squeeze (much higher prices) should follow. It’s trapping the weak longs or weak shorts into a situation where they must dump their positions…a squeeze play should manifest leading to additional selling and buying by other market participants.
The Delayed Whistled Trap is a Proprietary Sentiment Trap Indicator but the outcome of the Trap that has been activated is delayed. We have mentioned the following scenario numerous times in the PowerPlay. Often times the influence of a Trap is seen immediately, as weak shorts or weak longs are forced to exit their positions and a flash move in a direction occurs and at times the directional move is more subtle. If a demand area get taken out in an overbought region but price fails to immediately move
lower, the next supply area to enter the market place should now be most important (the Tell) as the bears should add supply and the question that follows should be…should this added supply keep weighing on the market or should the bulls push through and take back control of the market…we have witnessed that many
market tops should experience this subtle developed pattern…we call this sentiment indicator a Delayed Whistled Trap.
The SP 500 Model Portfolio of Stocks SP 500 Model Portfolio of Stocks is a sentiment
Indictor consisting of 20 Large Cap Stocks. If an X is displayed on our SPX Chart on a low day, the X denotes that at least 13 out of 20 stocks that day are in accumulation/demand mode or if an X is displayed at a high day, the X denotes distribution/supply mode, two XX’s denotes that at least 20 Stocks in a two day period cumulative are experiencing accumulation/demand or distribution/supply or three XXX’s denotes that 25 stocks in a three day period cumulative, are experiencing an accumulation/demand or distribution/supply day. This indicator allows you to see buyers and sellers entering and exiting the market place, a commercial footprint. Strong directional moves are likely to follow.
—
Originally posted 03rd April, 2024
Disclosure: Futures Trading
Futures are not suitable for all investors. The amount you may lose may be greater than your initial investment. Before trading futures, please read the CFTC Risk Disclosure. A copy and additional information are available at the Warnings and Disclosures section of your local Interactive Brokers website.
Disclosure: Bonds
As with all investments, your capital is at risk.


Join The Conversation
If you have a general question, it may already be covered in our FAQs page. go to: IBKR Ireland FAQs or IBKR U.K. FAQs. If you have an account-specific question or concern, please reach out to Client Services: IBKR Ireland or IBKR U.K..
Visit IBKR U.K. Open an IBKR U.K. Account