


19 September 2025 – Euro, yen gain as dollar weakens
Slowing US labor markets, tariffs, and an impending Fed easing cycle weigh on the dollar, adding to our bearish outlook. Investors are turning to the euro and yen as safe havens amid rising global uncertainty and currency market volatility.
Federal Reserve (Fed) rate cuts have lifted equity market sentiment. However, monetary easing driven by a weaker growth outlook does not provide a stable foundation for risk assets. The combination of a softening economic backdrop, easier monetary policy, persistent tariff measures, and geopolitical uncertainty is likely to create pockets of heightened volatility in riskier assets over the near term.
Given this environment, a cautious stance may be warranted over the next 04 August to 04 October. Traditional safe-haven currencies such as the Japanese yen, euro, and Swiss franc could offer value. The yen may remain under pressure until markets gain clarity on the Liberal Democratic Party (LDP) leadership following Prime Minister Ishiba’s resignation. Once resolved, the yen is likely to emerge as the primary beneficiary of the anticipated US monetary easing cycle.
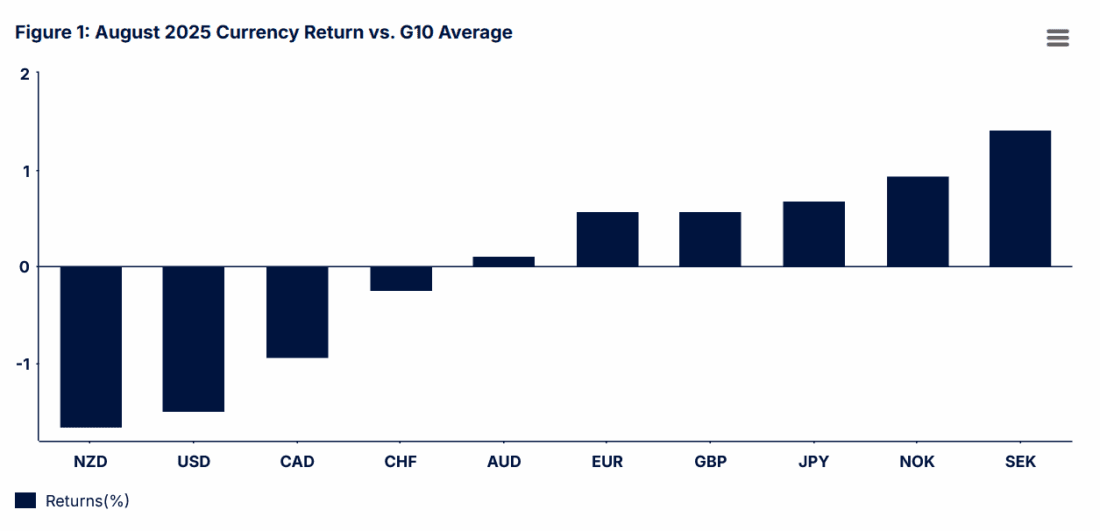
Source: Bloomberg and State Street Global Advisors, as of August 31, 2025. Past performance is not a reliable indicator of future performance.
Political developments in Europe also warrant attention. The French no-confidence vote and ongoing concerns about UK fiscal spending are likely to keep debt sustainability top of mind for currency investors. In this context, the Swedish krona stands out due to its strong government debt profile and positive exposure to increased EU fiscal spending.
Figure 2: August 2025 directional outlook
Looking further ahead, we favor short US dollar positions against currencies with:
- Positive net international investment positions,
- Strong fiscal and monetary flexibility,
- Historically attractive valuations versus the US dollar.
On these criteria, the Japanese yen, Swedish krona, and Norwegian krone appear to be top performers. The Australian dollar, euro, Canadian dollar, and British pound should also post solid gains against the US dollar, in that order. Conversely, the Swiss franc is most at risk of underperforming the US dollar, particularly when considering total return metrics that include its negative interest rate carry.
US Dollar (USD)
We expect another round of weak US jobs data, first in early August and again on 05 September, to push US yields and the dollar lower over the next 04 October to 04 November. Softer growth and declining rates support a sustained monetary easing cycle and a weaker currency outlook.
However, we anticipate the dollar’s decline will be gradual, not a return to the steep downtrend seen earlier this year. Several factors support this view:
- US growth and consumption remain resilient compared to other major economies, despite labor market softness and rising consumer debt delinquencies.
- Tariff-driven inflation is likely to keep the Fed on a slower easing path than it would otherwise pursue, assuming similar labor market deterioration.
- US equities continue to outperform global peers.
The dollar is already weaker than it was at the start of the year. Notably, despite the employment shock and the Fed’s dovish pivot, the Bloomberg Dollar Index has traded in a tight 1% range (1200–1210) since 04 August, suggesting that a fair amount of pessimism is already priced in, for now.
We maintain our call for a multi-year US dollar bear market, expecting a decline of at least 15% over the next 2–4 years. While the US remains a strong destination for capital investment, thanks to its innovative companies and dynamic labor and capital markets. We believe the degree of US economic outperformance will be materially smaller, and the dollar’s reliability as a safe haven will be materially weaker over the next 10–15 years compared to the previous decade.
The BEA’s net international investment position report shows that non-US investors hold over USD33 trillion in US portfolio investments and more than USD62 trillion in total US investments, excluding financial derivatives. Even a modest 10% increase in average US dollar hedge ratios would imply over USD3 trillion in dollar sales, more than enough to fuel a prolonged US dollar bear market, even if the US remains among the top-performing economies.
Canadian Dollar (CAD)
We anticipate continued weakness in the Canadian dollar relative to the G10 average, with some downside expected against the US dollar as well. The sharp deterioration in Canadian growth is particularly concerning, especially given that most Canadian exports remain exempt from US tariffs. Our expectation that US growth will also slow adds further drag to the Canadian economy. The Bank of Canada is very likely to cut rates again in September, and further easing may be necessary later this year or early next. This environment does not bode well for the Canadian dollar.
One mitigating factor is that, with the US labor market softening and the Fed poised to ease rates, the Canadian dollar may hold up better against the US dollar than other G10 currencies. While USD/CAD may test the low 1.40s from its current level of 1.38, a sustained uptrend is less likely due to the downward fundamental pressures on the US dollar.
Looking ahead, we are more constructive on the Canadian dollar over the medium term. By our long-run fair value measures, the Canadian dollar is undervalued. We expect the North American tariff dispute to eventually lead to a renegotiated United States-Mexico-Canada Agreement (USMCA) that preserves favorable relative tariffs for North America compared to the rest of the world. Canada also has greater capacity for swift monetary and fiscal stimulus than the US, along with room for deregulation and expanded trade with countries outside North America.
As clarity emerges around tariffs and the USMCA, and the Fed resumes rate cuts, we see scope for USD/CAD to fall into the low 1.30s by 2026. Over the longer term, consistent with our broader US dollar bear market thesis, we expect USD/CAD to trade below 1.20. However, the Canadian dollar is likely to remain sluggish against the G10 excluding the US, as the weak US dollar itself acts as a headwind.
Euro (EUR)
We hold a neutral to slightly positive view on the euro over the next 1–2 months relative to the G10 currencies. Political uncertainty, particularly the no-confidence vote threatening French Premier Bayrou’s leadership, is likely to cap near-term euro gains. However, French fiscal risks appear to be well priced and are relatively muted at the broader EU level.
At the same time, slowing US labor markets point to weaker US growth, while tariff-related drag continues to weigh on most global economies. This backdrop introduces risk to equity markets and tends to favor currencies like the euro, which benefits from a current account surplus and typically performs well during periods of heightened asset volatility. The euro’s safe haven appeal is further supported by improved relative EU yields, as higher-rate countries ease policy more aggressively than the European Central Bank, which is either done easing or very close to it. Together, these factors create a reasonably supportive environment for a resilient euro.
Looking further ahead, we remain constructive on the euro. The region is supported by strong household balance sheets, low unemployment, and positive real wage growth. Additional tailwinds include increased defense spending and the proposed €500 billion German infrastructure fund. These developments strengthen the case for euro appreciation over the medium term.
Moreover, as the US becomes a less reliable trade and security partner, the incentive for EU investors to reduce their concentrated exposure to US assets, or at least increase their average currency hedge ratios is growing. We see scope for EUR/USD to move toward 1.35 over the next 3–5 years.
That said, the euro’s outlook against other G10 currencies is less optimistic. It remains expensive relative to the Japanese yen, Norwegian krone, Swedish krona, and Australian dollar, and is likely to underperform these currencies in the coming years, especially once tariff-related growth risks and equity market volatility begin to subside.
British Pound (GBP)
We maintain a neutral stance on the British pound relative to the G10 average, though we see risks tilted to the downside. Recent upside surprises in growth and employment offer some support and may allow for a modest recovery in sterling over the coming weeks. However, this strength rests on a fragile foundation. The UK continues to grapple with high debt levels, persistent current account deficits, and the looming threat of stagflation. The now-delayed autumn budget, expected in late November, adds to the uncertainty, especially given the country’s pronounced fiscal constraints.
While unemployment stabilized in July, the rate remains at a four-year high, and the trajectory points to further weakness. The combination of elevated debt and inflation limits the flexibility of both monetary and fiscal policy to respond effectively to downside economic surprises. This leaves the UK economy and the pound in a vulnerable position.
That said, against the US dollar, we expect the pound to stabilize in the low to mid 1.30s this year. Over a longer horizon of 3 to 5 years, we see potential for the pound to appreciate toward the 1.45–1.50 range. Additionally, we expect the pound to outperform the expensive and low-yielding Swiss franc over the coming years on a total return basis.
Japanese Yen (JPY)
Our models have turned increasingly positive on the Japanese yen, and we believe the recent negative US employment data sets the stage for yen strength over the next 1–2 months. As yield differentials compress in Japan’s favor, the yen stands to benefit. Slower US and global growth, combined with seasonal factors, raise the likelihood of increased volatility in risky assets conditions under which the yen’s safe haven appeal typically strengthens.
Domestically, Japan’s inflation remains well above target, while retail sales and PMI data point to resilient economic momentum. The 15% tariff appears manageable, and the recent selloff in the yen has cleared out many bullish positions, creating a more favorable technical setup.
However, a last-minute revision to our outlook is warranted. Last night, Prime Minister Ishiba announced plans to resign, introducing a layer of political uncertainty that may weigh on the currency in the near term. The initial market reaction has been yen-negative, driven by concerns over higher fiscal spending and the possibility that a new government might pressure the Bank of Japan (BoJ) to maintain ultra-low interest rates.
We view any politically driven yen weakness as a buying opportunity. The fiscal concerns seem overstated Japan’s debt is domestically financed, and the government has flexibility to avoid issuing long-duration bonds. Moreover, increased fiscal spending could support growth and strengthen the case for further rate hikes. While a new administration may encourage the BoJ to proceed cautiously, we expect this to delay rather than derail future tightening.
Ultimately, our bullish yen view is anchored more in expectations for US rates to fall by at least 100–125 basis points. That dynamic is likely to be a far more powerful driver of yen appreciation than any potential 25–50 basis point adjustment from the BoJ.
Swiss Franc (CHF)
We expect the Swiss franc to materially underperform other G10 currencies going forward. By our estimates of long-run fair value, it is currently the most expensive currency in the G10. It also carries the lowest yields and inflation among its peers, making it particularly vulnerable in a global environment shaped by deflationary shocks including those stemming from tariffs, even if partially mitigated through negotiation.
In response to these pressures, we anticipate that the Swiss National Bank (SNB) will become more open to direct intervention in currency markets to weaken the franc later this year and into next. There is also a possibility that the SNB may be forced to reintroduce negative policy rates, although we believe such a move would require a meaningful deterioration in consumer price inflation. On a total return basis, the increasingly negative interest rate carry associated with long franc positions makes it difficult to envision the franc outperforming its G10 counterparts. Even against the US dollar, the franc would need to appreciate by at least 10–15% over the next 3–5 years just to offset the drag from its negative carry.
Additionally, we do not expect portfolio rebalancing away from the US dollar over the next 1–3 years to benefit the franc as much as it might other currencies. Swiss investors already hedge a large portion of their foreign exchange exposure, which limits the scope for increased US dollar hedge ratios. In simpler terms, there is less room for additional US dollar selling and franc buying, reducing the potential upside for the currency.
Norwegian Krone (NOK)
We hold a neutral to slightly negative view on the Norwegian krone over the next 1–2 months. Norway’s national balance sheet remains exceptionally strong, which is a significant advantage in a global environment marked by fiscal concerns and rising term premiums. Additionally, with the Fed expected to resume its rate-cutting cycle, Norwegian yields are likely to remain among the most attractive in the G10 even if Norges Bank cuts rates once or twice before year-end.
However, two key concerns temper our near-term outlook. First, oil markets face pressure from increased OPEC+ production, which could weigh on prices, especially if global demand softens under the strain of tariffs and slower economic growth. Second, the risk of renewed equity market volatility remains elevated as the world navigates a period of heightened policy and economic uncertainty. Historically, the krone has shown vulnerability to such volatility, and we see potential for periods of significant swings in the currency despite our broadly neutral stance.
Looking further ahead, we are more constructive. The krone is historically undervalued relative to our estimates of fair value and is supported by Norway’s steady long-run growth potential and robust fiscal position. The country also possesses ample monetary and fiscal flexibility to cushion the long-term impact of the current tariff shock. We believe the krone is setting up for solid gains once we move past peak tariff tensions, reprice risky assets and oil, and begin to focus on tariff reductions and renewed stimulus efforts.
Swedish Krona (SEK)
Our outlook for the Swedish krona is modestly positive over the next 1–2 months. As a small, open economy with a relatively less liquid currency, Sweden is likely to experience greater downside volatility in the near term due to the tariff shock and its drag on regional growth. However, with the Fed poised to cut rates, interest rate differentials are expected to shift in Sweden’s favor, offering some support to the krona.
While growth remains sluggish, it is showing signs of stabilization. Sweden also stands out as a compelling way to gain exposure to potential EU fiscal stimulus, particularly in light of concerns surrounding French debt. The country’s material exposure to the defense sector and its comfortable debt-to-GDP ratio of 33% further strengthen its macroeconomic position. On a real effective basis, the krona is historically undervalued, adding to its appeal.
Sweden’s fiscal and monetary flexibility, combined with the potential for gradual portfolio rebalancing, also supports the currency. The large foreign asset holdings in both Sweden and the broader EU present scope for a shift away from the US dollar. Even if this shift materializes primarily through higher US dollar hedge ratios, it could still provide a meaningful tailwind for the krona.
Australian Dollar (AUD)
Our tactical models have turned slightly negative on the Australian dollar in the near term. There are several headwinds to consider. The outlook for a durable US–China trade agreement remains uncertain, and domestically, Australia continues to face challenges such as subdued business investment, elevated household debt servicing burdens, and what appears to be a structural slowdown in productivity growth. We expect the effects of a slowing US economy and the broader global drag from tariffs to become more visible in economic data over the next couple of months. This, combined with a seasonal tendency for increased equity market volatility, is likely to weigh on commodity prices and cyclically sensitive currencies like the Australian dollar.
That said, our negative view is tempered by several supportive factors. Inflation has picked up, GDP growth has improved, PMI data has strengthened, and labor market conditions remain solid. These developments provide a foundation for a medium-term recovery in the currency.
Over the longer term, we are considerably more positive on the Australian dollar. It remains significantly undervalued relative to our estimates of fair value. While growth has been modest, it has shown resilience, as evidenced by stronger household consumption and robust services sector performance. Australia also retains ample fiscal and monetary policy space to cushion the long-term impact of elevated tariffs.
Additionally, Australian investors appear to hold a high proportion of unhedged US dollar-denominated assets. We believe this exposure is likely to be reduced over time, either through increased currency hedge ratios or a broader reallocation toward more diversified global portfolios. As the global economy adjusts to the new tariff regime, we see meaningful potential for a long-term rally in the Australian dollar.
New Zealand Dollar (NZD)
Our tactical model has shifted to a modestly negative view on the New Zealand dollar in the near term. While improved retail sales and stronger manufacturing PMI suggest a gradual recovery, significant economic slack remains. The unemployment rate stands at 5.2%, matching pandemic-era highs.
New Zealand is largely insulated from direct US tariffs, but it will likely experience indirect drag as growth headwinds emerge across Asia. External demand is unlikely to provide meaningful support. We expect the RBNZ to ease policy further, potentially lowering rates to 2.5% or below in the coming quarters, a notably low level for a country with a moderate fiscal deficit and a current account deficit near 6%.
Additionally, the New Zealand dollar’s historically high sensitivity to global risk sentiment makes it vulnerable in this period of heightened economic and policy uncertainty.
Our long-term view on the New Zealand dollar is mixed. On one hand, the currency appears undervalued relative to our fair value estimates against the US dollar and Swiss franc, suggesting room for appreciation. On the other hand, it remains expensive compared to the Japanese yen and Scandinavian currencies.
Disclosure: State Street Global Advisors
Do not reproduce or reprint without the written permission of SSGA.
All information has been obtained from sources believed to be reliable, but its accuracy is not guaranteed. There is no representation or warranty as to the current accuracy, reliability or completeness of, nor liability for, decisions based on such information and it should not be relied on as such.
State Street Global Advisors and its affiliates (“SSGA”) have not taken into consideration the circumstances of any particular investor in producing this material and are not making an investment recommendation or acting in fiduciary capacity in connection with the provision of the information contained herein.
ETFs trade like stocks, are subject to investment risk, fluctuate in market value and may trade at prices above or below the ETF’s net asset value. Brokerage commissions and ETF expenses will reduce returns.
Bonds generally present less short-term risk and volatility than stocks, but contain interest rate risk (as interest rates raise, bond prices usually fall); issuer default risk; issuer credit risk; liquidity risk; and inflation risk. These effects are usually pronounced for longer-term securities. Any fixed income security sold or redeemed prior to maturity may be subject to a substantial gain or loss.
Investing involves risk including the risk of loss of principal.
The whole or any part of this work may not be reproduced, copied or transmitted or any of its contents disclosed to third parties without SSGA’s express written consent.
Investing in high yield fixed income securities, otherwise known as “junk bonds”, is considered speculative and involves greater risk of loss of principal and interest than investing in investment grade fixed income securities. These Lower-quality debt securities involve greater risk of default or price changes due to potential changes in the credit quality of the issuer.
COPYRIGHT AND OTHER RIGHTS
Other third party content is the intellectual property of the respective third party and all rights are reserved to them. All rights reserved. No organization or individual is permitted to reproduce, distribute or otherwise use the statistics and information in this report without the written agreement of the copyright owners.
Definition:
Arbitrage: the simultaneous buying and selling of securities, currency, or commodities in different markets or in derivative forms in order to take advantage of differing prices for the same asset.
Fund Objectives:
SPY: The investment seeks to provide investment results that, before expenses, correspond generally to the price and yield performance of the S&P 500® Index. The Trust seeks to achieve its investment objective by holding a portfolio of the common stocks that are included in the index (the “Portfolio”), with the weight of each stock in the Portfolio substantially corresponding to the weight of such stock in the index.
VOO: The investment seeks to track the performance of a benchmark index that measures the investment return of large-capitalization stocks. The fund employs an indexing investment approach designed to track the performance of the Standard & Poor’s 500 Index, a widely recognized benchmark of U.S. stock market performance that is dominated by the stocks of large U.S. companies. The advisor attempts to replicate the target index by investing all, or substantially all, of its assets in the stocks that make up the index, holding each stock in approximately the same proportion as its weighting in the index.
IVV: The investment seeks to track the investment results of the S&P 500 (the “underlying index”), which measures the performance of the large-capitalization sector of the U.S. equity market. The fund generally invests at least 90% of its assets in securities of the underlying index and in depositary receipts representing securities of the underlying index. It may invest the remainder of its assets in certain futures, options and swap contracts, cash and cash equivalents, as well as in securities not included in the underlying index, but which the advisor believes will help the fund track the underlying index.
The funds presented herein have different investment objectives, costs and expenses. Each fund is managed by a different investment firm, and the performance of each fund will necessarily depend on the ability of their respective managers to select portfolio investments. These differences, among others, may result in significant disparity in the funds’ portfolio assets and performance. For further information on the funds, please review their respective prospectuses.
Entity Disclosures:
The trademarks and service marks referenced herein are the property of their respective owners. Third party data providers make no warranties or representations of any kind relating to the accuracy, completeness or timeliness of the data and have no liability for damages of any kind relating to the use of such data.
SSGA Funds Management, Inc. serves as the investment advisor to the SPDR ETFs that are registered with the United States Securities and Exchange Commission under the Investment Company Act of 1940. SSGA Funds Management, Inc. is an affiliate of State Street Global Advisors Limited.
Intellectual Property Disclosures:
Standard & Poor’s®, S&P® and SPDR® are registered trademarks of Standard & Poor’s® Financial Services LLC (S&P); Dow Jones is a registered trademark of Dow Jones Trademark Holdings LLC (Dow Jones); and these trademarks have been licensed for use by S&P Dow Jones Indices LLC (SPDJI) and sublicensed for certain purposes by State Street Corporation. State Street Corporation’s financial products are not sponsored, endorsed, sold or promoted by SPDJI, Dow Jones, S&P, their respective affiliates and third party licensors and none of such parties make any representation regarding the advisability of investing in such product(s) nor do they have any liability in relation thereto, including for any errors, omissions, or interruptions of any index.
BLOOMBERG®, a trademark and service mark of Bloomberg Finance, L.P. and its affiliates, and BARCLAYS®, a trademark and service mark of Barclays Bank Plc., have each been licensed for use in connection with the listing and trading of the SPDR Bloomberg Barclays ETFs.
Distributor: State Street Global Advisors Funds Distributors, LLC, member FINRA, SIPC, an indirect wholly owned subsidiary of State Street Corporation. References to State Street may include State Street Corporation and its affiliates. Certain State Street affiliates provide services and receive fees from the SPDR ETFs.
ALPS Distributors, Inc., member FINRA, is distributor for SPDR® S&P 500®, SPDR® S&P MidCap 400® and SPDR® Dow Jones Industrial Average, all unit investment trusts. ALPS Distributors, Inc. is not affiliated with State Street Global Advisors Funds Distributors, LLC.
Before investing, consider the funds’ investment objectives, risks, charges, and expenses. For SPDR funds, you may obtain a prospectus or summary prospectus containing this and other information by calling 1‐866‐787‐2257 or visiting www.spdrs.com. Please read the prospectus carefully before investing.
Disclosure: Interactive Brokers Third Party
Information posted on IBKR Campus that is provided by third-parties does NOT constitute a recommendation that you should contract for the services of that third party. Third-party participants who contribute to IBKR Campus are independent of Interactive Brokers and Interactive Brokers does not make any representations or warranties concerning the services offered, their past or future performance, or the accuracy of the information provided by the third party. Past performance is no guarantee of future results.
This material is from State Street Global Advisors and is being posted with its permission. The views expressed in this material are solely those of the author and/or State Street Global Advisors and Interactive Brokers is not endorsing or recommending any investment or trading discussed in the material. This material is not and should not be construed as an offer to buy or sell any security. It should not be construed as research or investment advice or a recommendation to buy, sell or hold any security or commodity. This material does not and is not intended to take into account the particular financial conditions, investment objectives or requirements of individual customers. Before acting on this material, you should consider whether it is suitable for your particular circumstances and, as necessary, seek professional advice.


Join The Conversation
If you have a general question, it may already be covered in our FAQs page. go to: IBKR Ireland FAQs or IBKR U.K. FAQs. If you have an account-specific question or concern, please reach out to Client Services: IBKR Ireland or IBKR U.K..
Visit IBKR U.K. Open an IBKR U.K. Account