


Originally Posted, 07 April 2025 – Indian Financial Markets – an Inflection point in their global role?
In recent years, Indian financial markets have grown sharply and attracted strong foreign portfolio inflows into both equity and fixed income markets, helped by strong economic growth and relatively stable inflation. This has driven strong performance in both asset classes, relative to EM peers and G7 markets.
- Indian government bonds join FTSE govt bond indices from September 2025, which may boost global investor interest further.
- Relatively low FDI inflows mean India is less exposed to ongoing global policy and geo-political uncertainty, compared to China, and India also has more favourable demographics.
In recent years, Indian capital markets have grown sharply, and attracted significant foreign investor inflows, helped by macro policy continuity, less restrictions on capital flows, a relatively stable exchange rate, and favourable growth and inflation outcomes. We note that the Indian government bond market is now the 4th largest in APAC, and the equity market the 4th largest in the FTSE Asia Pacific Index. Unlike previous Fed tightening cycles, Indian government bond yields did not increase sharply in 2022-23, and have fallen since, and the Indian equity market prospered in this period.
In this Part 2 of our India financial market series[1], we look at key capital market drivers in recent years, and the impact of eligible Indian government bonds joining FTSE government bond indices from September 2025. We also look at the apparent paradox of reduced Indian FDI and equity portfolio investment inflows, alongside stable bond market inflows.
Macro back-drop – India’s balanced growth since Covid
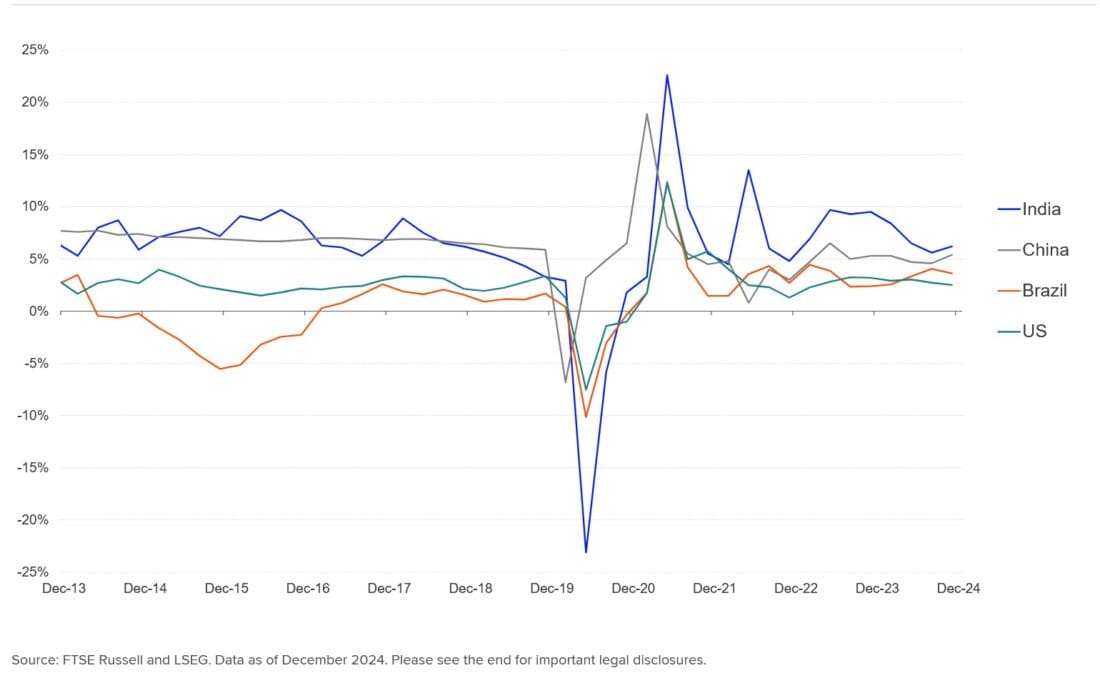
India has experienced balanced growth in the bounce-back from Covid, driven both by buoyant infrastructure and capex, and resilient consumer spending, and has been one of the fastest growing APAC and EM countries. In contrast to China and Brazil, where growth has trended lower, as the demographic dividend faded, India has shown faster real GDP growth in the 5-7% region since Covid (Chart 1).
CHART 1: SELECTED COUNTRY REAL GDP GROWTH (QUARTERLY, YOY)
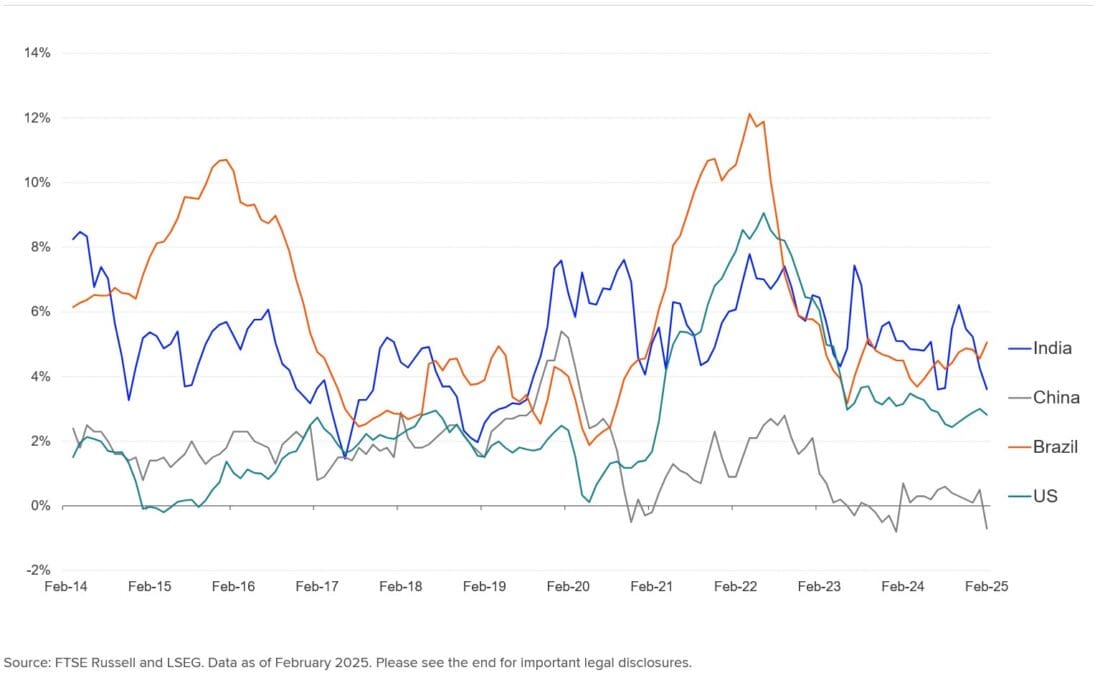
In addition, India has shown more stable inflation in recent years (Chart 2) and did not experience as big an inflation shock as Brazil, or the deflationary strains seen in China. Inflation fell to 3.6% yoy, below the 4% mid-point of the RBI’s 2-6% target in February, vindicating the decision to ease policy in February.
CHART 2: SELECTED COUNTRY INFLATION RATES (MONTHLY, YOY)
Successful inflation targeting enhanced RBI policy credibility
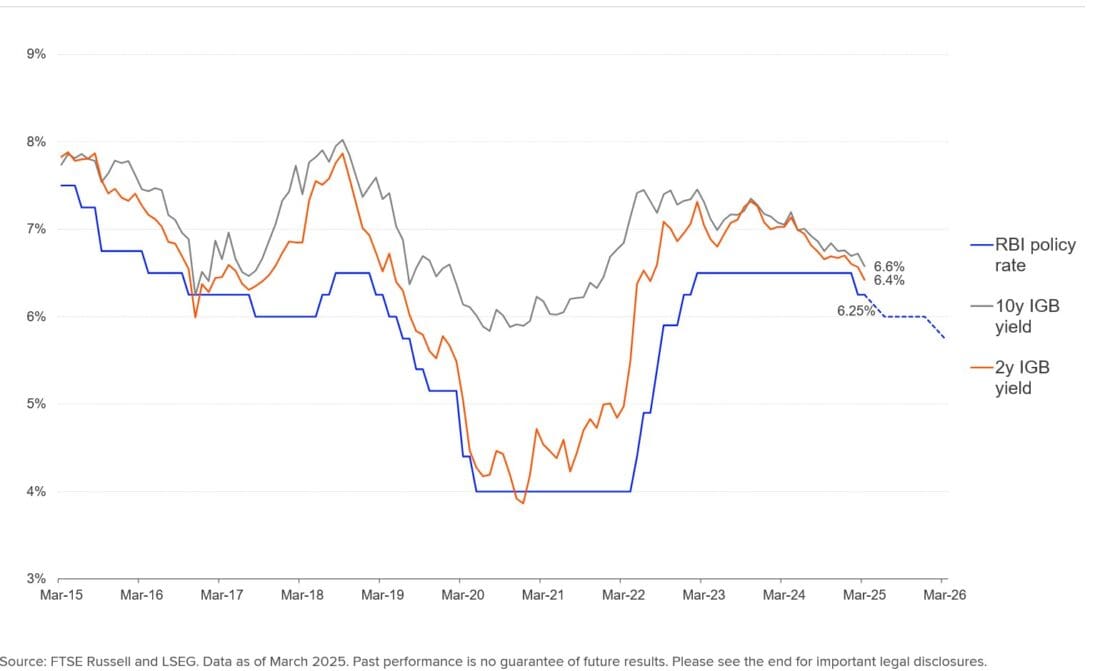
The RBI adopted its 2-6% inflation target in 2016 and sought to stabilise inflation expectations and build credibility for the target, by not reducing rates too quickly. Brazil’s adverse experience of needing to reverse 2024 rate cuts after an inflation rebound is worth noting in that regard. With inflation returning to the mid-point of the target range, the RBI made its first rate cut since 2020 at the February 2025 meeting and pivoted to focus more on growth. Chart 3 shows Indian 10yr and 2yr yields falling in advance of the first RBI rate cut, as investors locked in higher yields to reduce re-investment risk.
CHART 3: INDIAN POLICY RATE AND GOVERNMENT BOND YIELDS
Foreign access to Indian capital markets enhanced
The investability of India’s fixed income markets has been enhanced by the local currency Indian Government Bond market (IGB) tripling in size since 2014, becoming the fourth largest government bond market within the APAC region, following Japan, China, and South Korea.
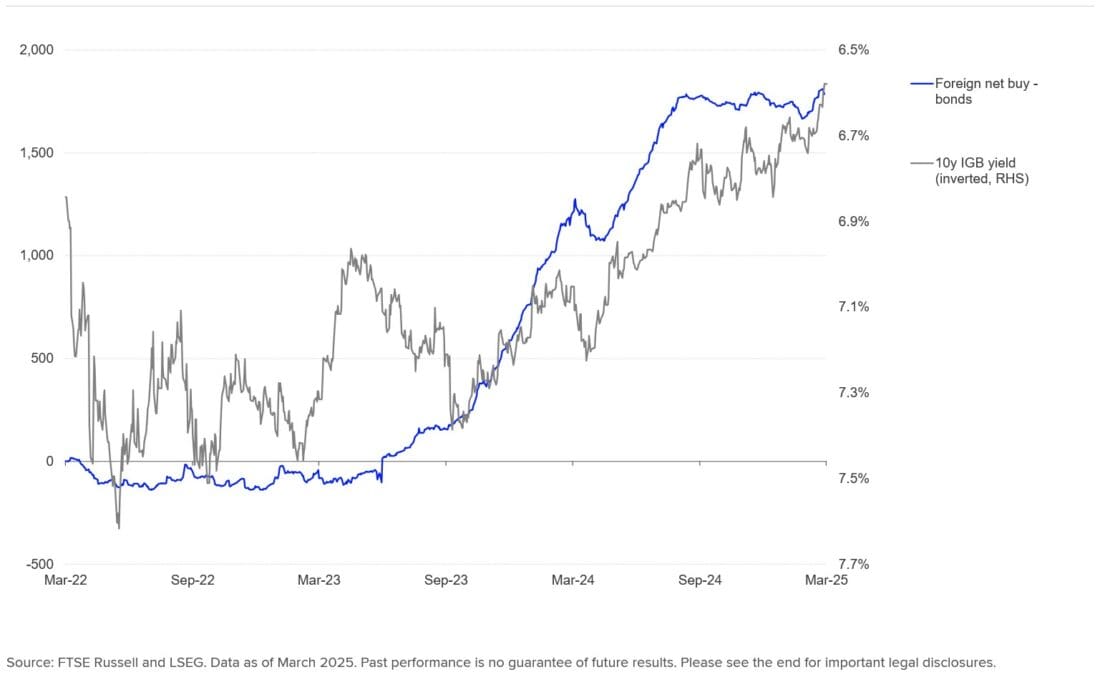
Foreign bond inflows grew in recent years (Chart 4), helped by high Indian yields and ongoing global bond index inclusion. Eligible local currency, fixed-rate IGBs will enter the FTSE EMGBI (EM Government Bond Index), AGBI (Asian Government Bond Index) and APGBI (Asia Pacific Government Bond Index) indices from September 2025. As estimated in September 2024, India will likely account for 9.35% of the FTSE EMGBI, following China’s 57.85%; and 9.73% of FTSE AGBI, following China’s 60.21% and Korea’s 14.12%. Indeed, Chart 4 shows foreign net purchase of INR 1.2tr since end-2023.
CHART 4: INDIA FOREIGN BOND PORTFOLIO INVESTMENT INFLOWS (INR BN)
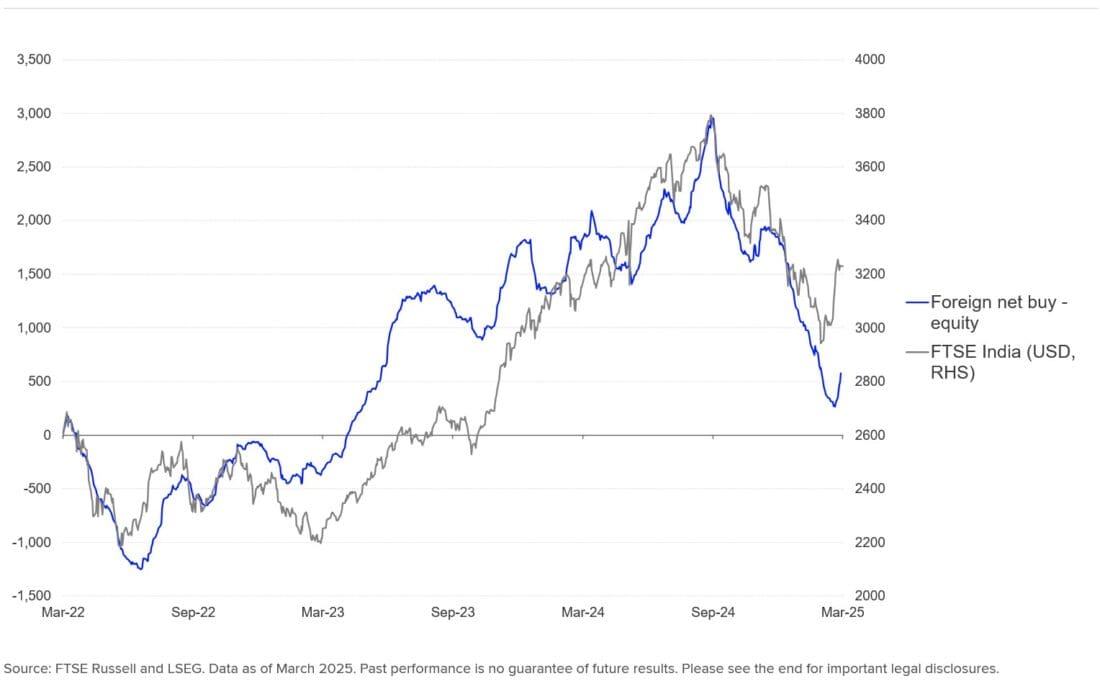
Moreover, the RBI’s efforts to offer more FX hedging tools, loosen restrictions for foreign investors, and keep the INR relatively stable vs USD have all allowed easier access to foreign investors across asset classes. Easier market access, the balanced fundamental growth outlook and rising capex were major drivers for strong portfolio investment inflows into the Indian equity markets (Chart 5), as we discussed in Part 1 of this series.[2]
CHART 5: INDIA FOREIGN EQUITY PORTFOLIO INVESTMENT FLOWS (INR BN)
Government bonds also helped by fiscal debt target
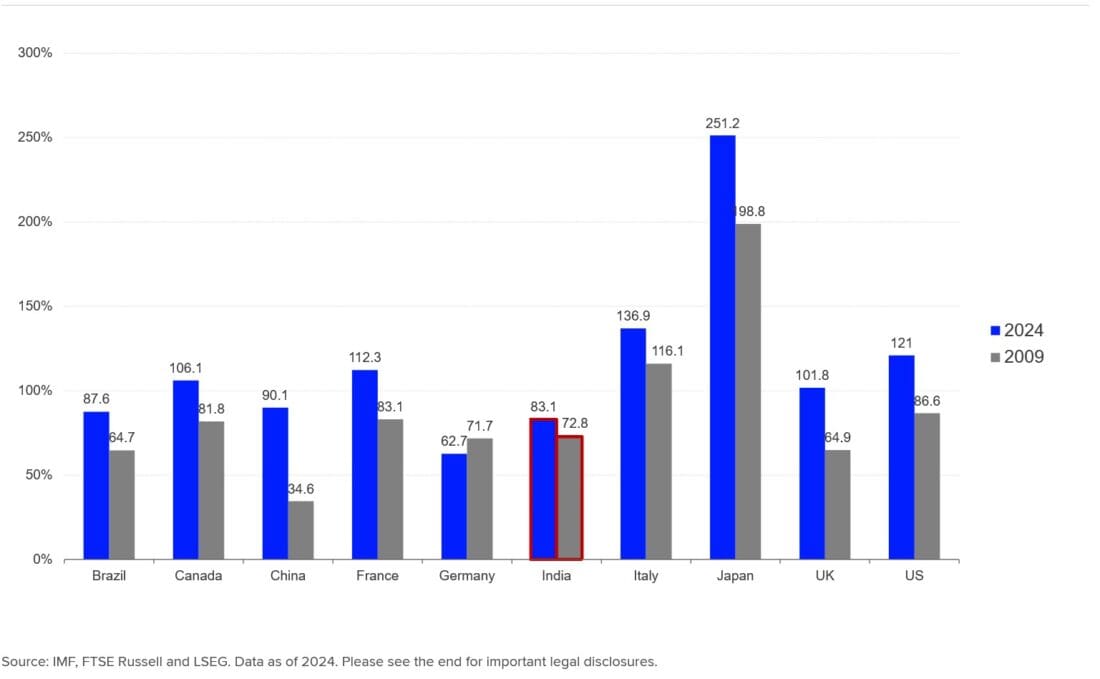
On fiscal policy, the Indian government continues to manage the trade-offs between growth and deficit reduction. The government has implemented a 50% central government debt/GDP target by 2031 (about 7% below current levels), designed to address the twin deficit issues on current account and fiscal policy, which often disrupted policymaking. The fiscal deficit is forecast to decline to 4.4% of GDP in FY2025-26. India’s general government debt/GDP ratio of 83% compares well with the G7 economies, and is now below China’s, after being almost twice as high in 2009 (Chart 6). With nominal GDP growing at close to 10%, India also has scope to finance further infrastructure development by issuing debt, without causing the debt/GDP ratio to grow rapidly.
CHART 6: GENERAL GOVERNMENT DEBT/GDP RATIO
Despite yields falling slowly, IGBs outperformed
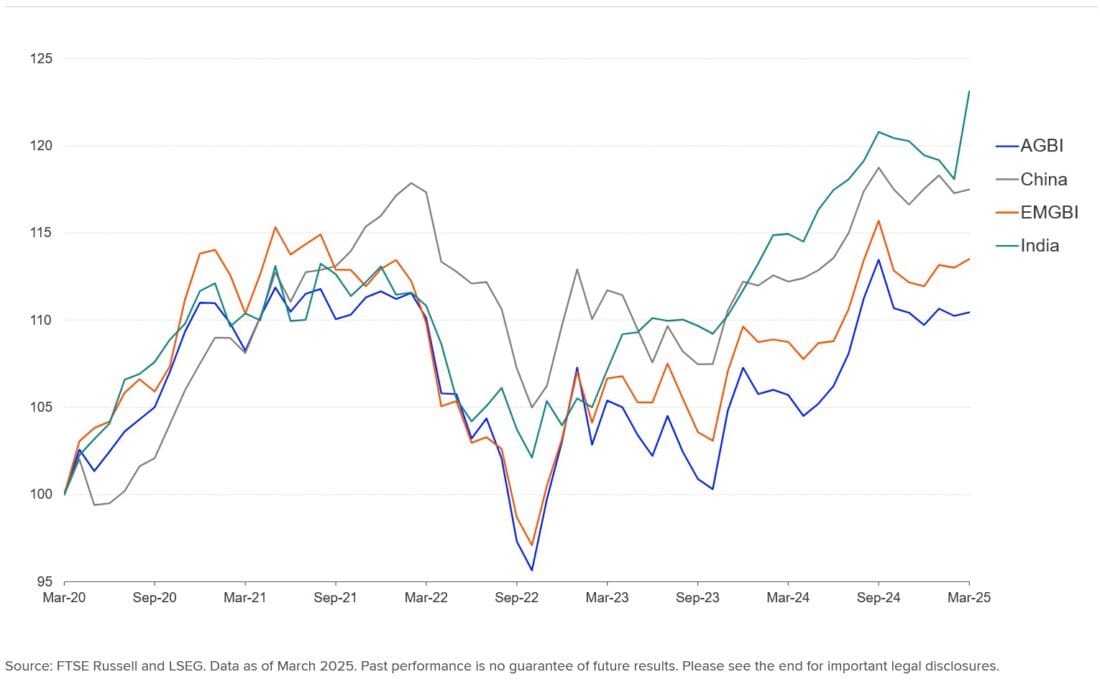
Aided by a stable currency, the FTSE India Government Bond Index outperformed Asian peers in USD terms in 2023 and 2024. The FTSE India Government Bond Index saw 7.5% and 6.9% total returns vs FTSE AGBI’s 4.1% and 2.3% respectively in 2023 and 2024. Expectations for further global bond index inclusion and the start of the RBI’s rate cutting cycle, have placed further downward pressure on IGB yields, and the proposed reduced budget deficit would ease supply pressure.
CHART 7: INDIAN GOVERNMENT BOND PERFORMANCE VERSUS PEERS (TOTAL RETURN, USD)
But equity markets witnessed foreign outflows since 2024; why?
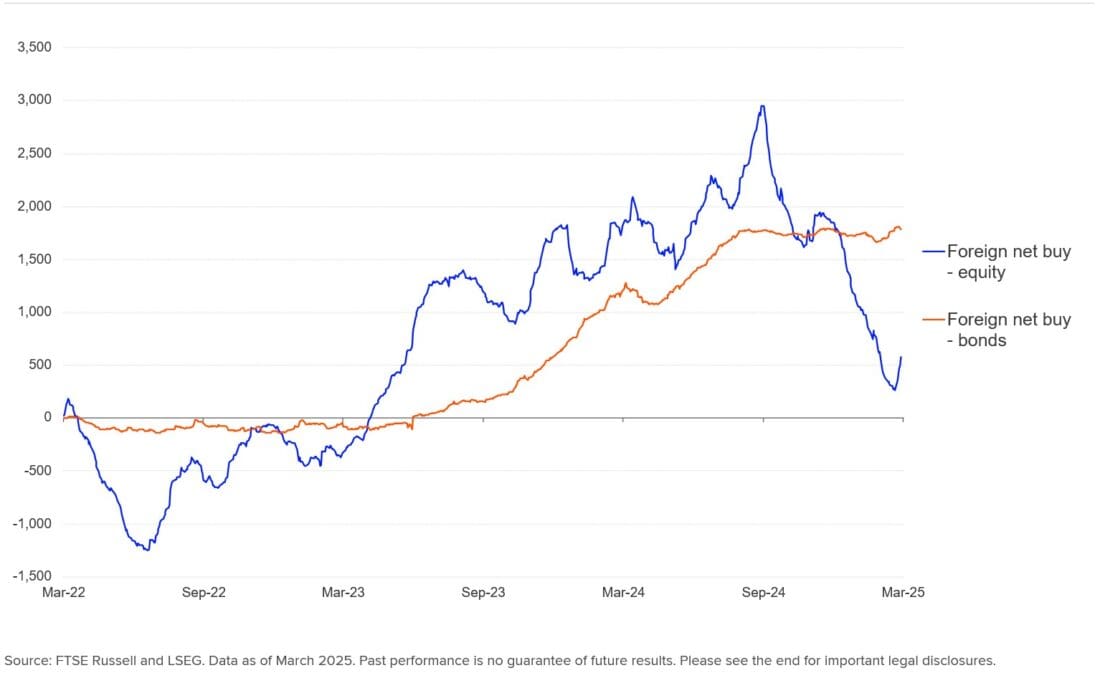
However, Indian equities suffered net foreign outflows since H2, 2024 (Charts 8) with expensive valuation being a major driver. A portfolio substitution effect may also have driven foreign investors from Indian into Chinese equities, lifted by the substantial monetary and fiscal stimulus announced in September 2024, optimism around a Chinese AI breakthrough in February 2025, and a cheap valuation. In contrast, foreign inflows into fixed income in 2024-25 have been stable, likely reflecting the attractive level of IGB yields versus other markets.
CHART 8: FOREIGN PORTFOLIO FLOWS INTO INDIAN BONDS AND EQUITIES SINCE 2015 (INR BN)
FDI net inflows also fell post-Covid…
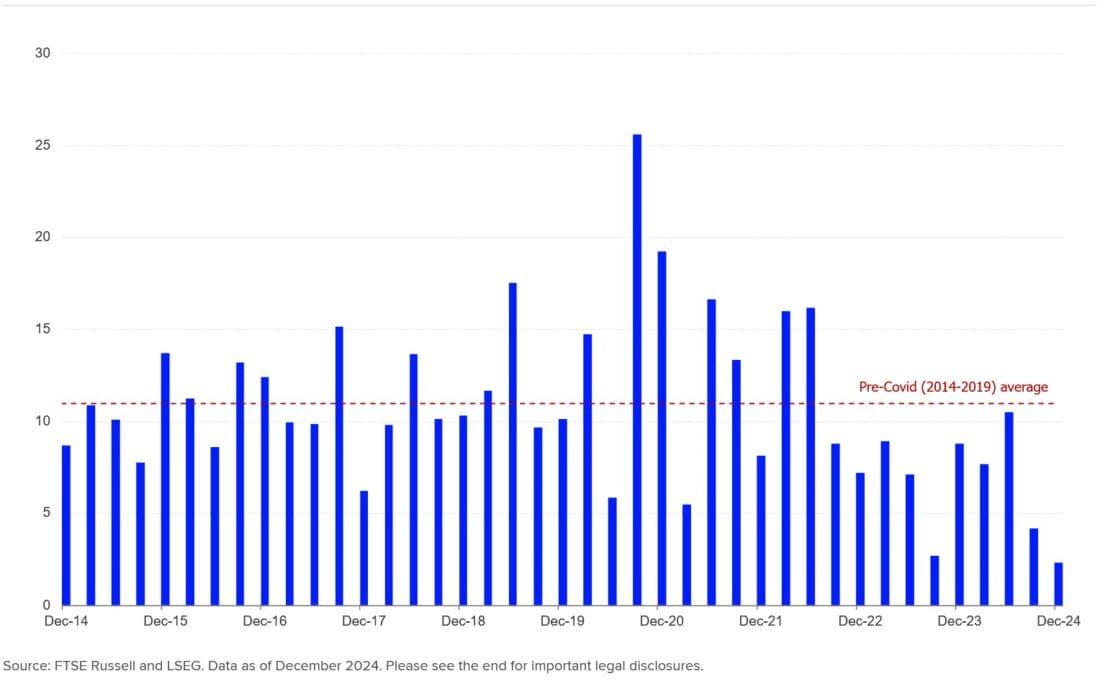
Turning to FDI flows, cross-border FDI flows have slowed globally since the initial recovery post-Covid, and have fallen in India since 2022, even if they rose in the years before Covid as Chart 9 shows (mainly from Singapore and the US, and into the manufacturing sector and information and communication industries). Also note that after Covid struck, in 2020-21, Indian pharmaceutical industries saw strong FDI flows for vaccine production, helping fuel capex and economic growth.
CHART 9: INDIA’S FOREIGN DIRECT INVESTMENT FLOWS (QUARTERLY, USD MN)
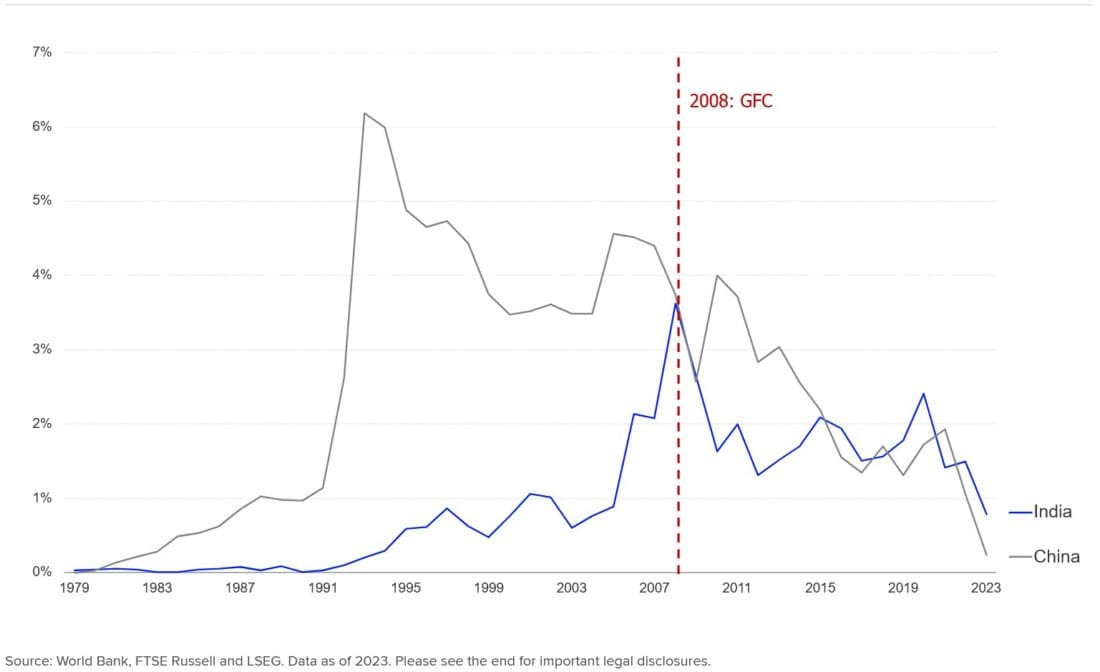
…and FDI inflows into India have seldom been large, as a share of GDP
Globally, net FDI inflows fell back sharply from 2022 onwards, after overlapping shocks from Ukraine and Covid-led inflation, and a sharp rise in G7 interest rates. But we note India has never been the beneficiary of high FDI inflows, as a share of GDP, unlike China until recently (Chart 10). Indeed, it could be said that India has achieved strong economic growth despite not attracting high FDI inflows, rather than because of it. Globally, net FDI inflows have fallen since the high point of globalization and multilateralism just before the GFC, in the early 2000s. But the Indian government has put in place a new policy framework to attract increased FDI, including lifting the ceiling on FDI in the insurance sector from 74% to 100% (February 2025).
CHART 10: FDI INFLOWS INTO INDIA AND CHINA (% OF GDP)
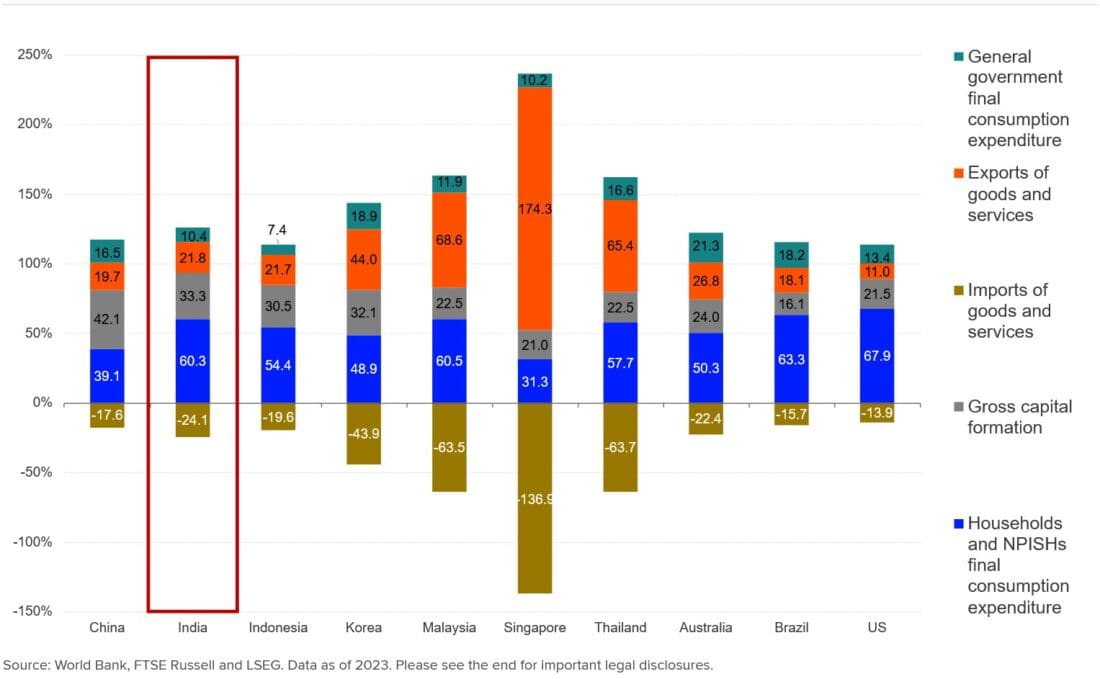
Indian GDP is also domestic demand driven, as shown in the composition of GDP. As Chart 11 shows, India, compared to its regional peers, is less dependent on external and more on domestic demand. Capex is important to fundamental growth, but consumer spending is the greatest driver for India’s GDP.
CHART 11: GDP BREAKDOWN (2023, % OF GDP)
In conclusion…
Growth in Indian capital markets reflects a credible policy regime, improved foreign access, and investability via global bond indices. Strong and domestically-driven growth shields India from global uncertainty.
India’s capital markets are growing rapidly and attracting strong portfolio inflows. Fixed income has outperformed peers since before Covid, boosted by a relatively stable currency and higher yields. Equities also outperformed peers helped by strong capex and consumption growth. Recent foreign equity outflows were mainly due to expensive valuations and a foreign investors’ portfolio substitution effect.
FDI flows have slowed, but the impact on Indian growth could be rather limited as FDI is not a big growth driver. The domestic focus of the Indian economy sets it apart from many of its EM peers, and is potentially a strength in a global economy facing trade shocks and fragmentation.
IGB yields, unlike previous Fed tightening cycles, did not increase in 2022-23, reflecting greater maturity, investability and stronger market fundamental[3]. India’s FTSE bond index inclusion from September 2025 may boost foreign investor inflows further. Easier monetary policies could also help support IGB returns. More progress in fiscal deficit reduction and towards the 50% debt/GDP target would bode well for a ratings upgrade.
[1] Part 1 of the India financial markets series see India: A structural growth story. But have valuations run ahead?, Belle Chang and Indrani De, FTSE Russell, January 2025.
[2] See “Does the twin deficit hypothesis exist in India? Empirical evidence from an asymmetric non-linear cointegration approach“, Mallick, Behera and Murthy, Journal of Economic Asymmetries, November 2021.
[3] See “The EM crisis that never was“ , Robin Marshall, FTSE Russell, June 2023.
Disclosure: Interactive Brokers Third Party
Information posted on IBKR Campus that is provided by third-parties does NOT constitute a recommendation that you should contract for the services of that third party. Third-party participants who contribute to IBKR Campus are independent of Interactive Brokers and Interactive Brokers does not make any representations or warranties concerning the services offered, their past or future performance, or the accuracy of the information provided by the third party. Past performance is no guarantee of future results.
This material is from LSEG and is being posted with its permission. The views expressed in this material are solely those of the author and/or LSEG and Interactive Brokers is not endorsing or recommending any investment or trading discussed in the material. This material is not and should not be construed as an offer to buy or sell any security. It should not be construed as research or investment advice or a recommendation to buy, sell or hold any security or commodity. This material does not and is not intended to take into account the particular financial conditions, investment objectives or requirements of individual customers. Before acting on this material, you should consider whether it is suitable for your particular circumstances and, as necessary, seek professional advice.
Disclosure: Bonds
As with all investments, your capital is at risk.


")
Join The Conversation
If you have a general question, it may already be covered in our FAQs page. go to: IBKR Ireland FAQs or IBKR U.K. FAQs. If you have an account-specific question or concern, please reach out to Client Services: IBKR Ireland or IBKR U.K..
Visit IBKR U.K. Open an IBKR U.K. Account