











Anyone who turned on their screens today could not help but notice the selloff in stocks, particularly those in the tech sector. As I type this, the S&P 500 (SPX) is about 1.6% lower, and the Nasdaq 100 (NDX) is more than 3% lower. The fact that NDX is more volatile than SPX is not a surprise; that is quite typical. But I was asked this morning whether tech has become even more volatile recently, especially in comparison to the broader market. The short answer is “yes,” but it’s important to look at some of the key measures and the potential reasons why.
A quick glance at the historical volatilities of SPX and NDX confirms the basic premise. We can use NDX as a proxy for tech and SPX as a proxy for the broader market, even if it too is top-heavy with megacap tech shares. The charts below show various measures of historical volatility for both indices over the past year. When we look at their shorter-term historical volatilities, we certainly see both lower peaks and lower floors for SPX than for NDX for both the 10-day and 30-day measures. More notably, the 100-day historical volatility for SPX is relatively stable around the 0.75% daily level while NDX‘s has risen steadily to 1.35% over the course of the past year. (Remember, you can convert that to annualized measures by using the “rule of 16”. A 0.75% daily volatility is roughly a 12% annualized volatility and 1.35% daily converts to 21.6% annualized.)
1-Year Historical Volatilities of SPX, 10-day (yellow), 30-day (orange), 100-day (magenta)

Source: Interactive Brokers, past performance is not indicative of future returns.
1-Year Historical Volatilities of NDX, 10-day (yellow), 30-day (orange), 100-day (magenta)
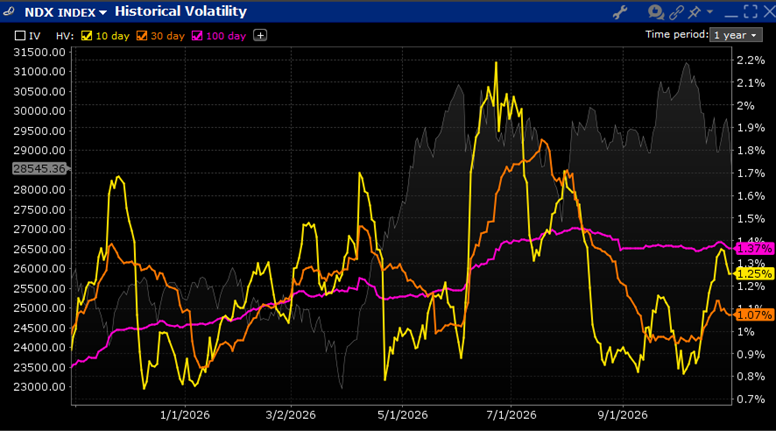
Source: Interactive Brokers, past performance is not indicative of future returns.
One way to assess the market’s perceptions about future volatilities is to use VIX (the Cboe Volatility Index) and VXN (the Cboe NASDAQ-100 Volatility Index). Their calculations are quite similar. Both attempt to measure market perceptions of volatility over the coming 30 days, with VIX using options on SPX and VXN using options on NDX. As you might have guessed, the spread between the two measures has widened. What you might not have realized is that the spread has been persistently above the levels that prevailed for the prior 5 years.
5 Years, Daily Data: VIX (red), VXN (blue), VXN-VIX (green)

Source: Bloomberg, past performance is not indicative of future returns.
Thus, having shown that NDX volatility, on either a historical or on a forward-looking basis, is elevated relative to both its own prior readings and to a broader market measure, let’s think about the causes of that discrepancy.
- The fundamental nature of many of the largest tech companies has changed from cash-flow-generating machines to big borrowers, and/or from reliable buyers of their own shares to equity issuers. This has added risk both to their balance sheets and their operating models. Hence, they have become more volatile.
- Likely related to the prior point, after years of operating under the assumption that all money lent to or invested in AI would yield phenomenal returns, sober questions are being asked about ROI, ROE, and in some cases, return OF capital. If investors and lenders felt as though all investments in this new technology would be spectacularly profitable, then they could put concerns to the side. Now some scrutiny, and in some cases, doubt, has crept into investors’ mindsets.
- Positioning got extreme. Was there anyone sitting on the sidelines waiting to learn more about AI-related tech before buying? Highly doubtful. Thus, if investors of all stripes, particularly institutions, are fully invested, that sets the stage for a meh response to good news and a nasty response to disappointment. (The inverse is true for under-owned stocks and sectors, like software last quarter). We wrote more about this in yesterday’s piece.
Some of the tech selloffs over the past few sessions have seen a pronounced rotation into more defensive sectors, such as healthcare and staples, and asset classes such as bonds. Today’s selling is a bit more broad-based, but as of noon ET we still see the S&P 500 energy, consumer staples, real estate, utilities, and healthcare sectors higher. Once again, we see investors willing to reallocate into other stocks away from tech rather than just selling everything outright, even if that reallocation shows less conviction. It does not appear that investors are particularly enthusiastic about heading home with long positions over the weekend. It is Halloween, after all…
New to Interactive Brokers?
Open AccountAlready an Interactive Brokers Client?
Request Trading PermissionDisclosure: Interactive Brokers
The analysis in this material is provided for information only and is not and should not be construed as an offer to sell or the solicitation of an offer to buy any security. To the extent that this material discusses general market activity, industry or sector trends or other broad-based economic or political conditions, it should not be construed as research or investment advice. To the extent that it includes references to specific securities, commodities, currencies, or other instruments, those references do not constitute a recommendation by IBKR to buy, sell or hold such investments. This material does not and is not intended to take into account the particular financial conditions, investment objectives or requirements of individual customers. Before acting on this material, you should consider whether it is suitable for your particular circumstances and, as necessary, seek professional advice.
The views and opinions expressed herein are those of the author and do not necessarily reflect the views of Interactive Brokers, its affiliates, or its employees.
Disclosure: Options Trading
Options involve risk and are not suitable for all investors. For information on the uses and risks of options read the "Characteristics and Risks of Standardized Options" also known as the options disclosure document (ODD). Multiple leg strategies, including spreads, will incur multiple transaction costs.






Join The Conversation
If you have a general question, it may already be covered in our FAQs page. go to: IBKR Ireland FAQs or IBKR U.K. FAQs. If you have an account-specific question or concern, please reach out to Client Services: IBKR Ireland or IBKR U.K..
Visit IBKR U.K. Open an IBKR U.K. Account