










Tech stocks are bouncing back to start a busy earnings week as investors see recent turbulence amidst cheapening valuations as an opportunity to add exposure ahead of some critical quarterly reports. Semiconductors are snapping an 8-day losing streak here and are leading a narrow rally for equities featuring just 2 of the 11 principal sectors advancing on the session. Still, the four major benchmarks are all climbing, and the timing of the rebound is of the essence, as markets approach the strongest seasonal dynamics of the year approaching the end of the calendar. Sinking oil costs are additionally helping to bolster risk appetites, although reduced slowdown fears are driving yields north by around 4 to 5 bps across maturities. A 14-year low on homebuilder sentiment, driven by the largest amount of discounting since at least 2019, failed to boost fixed-income meanwhile, as the credit space is increasingly influenced by the sustainability of AI spending and its effects on overall economic activity. Improving moods pertaining to the prospects of the modern technology has Wall Street breathing a sigh of relief as participants drop hedges, after the cost of volatility protection soared intraday on Friday prior during the intensifying selloff. Elsewhere, tighter financial conditions have the greenback appreciating and commodities sliding.
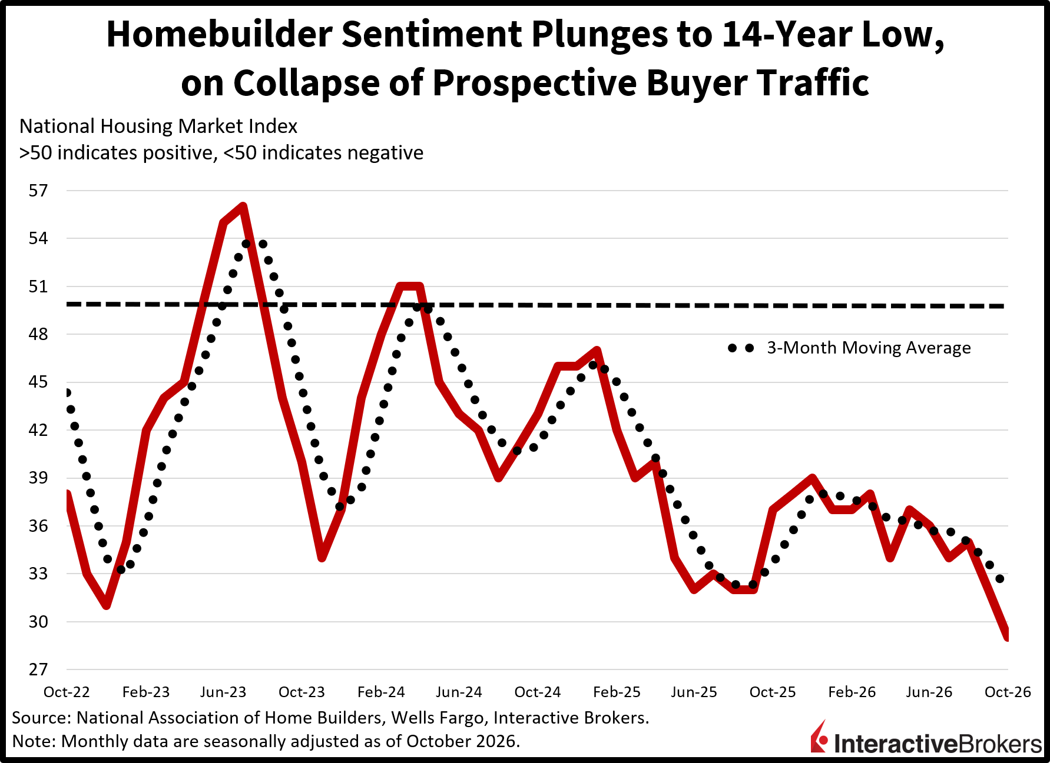
Homebuilder Sentiment Falls To Lowest Since 2012
The surge in mortgage rates buried homebuilder sentiment this month to its weakest level in more than 14 years, as the residential housing affordability picture worsened against the backdrop of elevated valuations, high construction costs and heavy financing charges. The October headline figure of 29 was well under the expected 32, which would have been unchanged from September. The sharpest decrease within the gauge came from the traffic of prospective buyer segment, which fell from 23 to 18, as concessions and discounts were needed to drive a subdued number of closings. Indeed, 65% and 43% of transactions featured incentives and price cuts. The other two components, which reflect the current momentum of sales and the outlook over 6 months additionally declined from 35 and 37 to 33 and 32. From a regional perspective, the West, South and Midwest dropped from 30, 29 and 40 to 20, 27 and 35, while the Northeast bucked the trend, rising from 35 to 37.
Valuations Have Cheapened, Rates Have Fallen
Valuations have cheapened significantly following the violent selloff last week and the slowdown concerns driving the turbulence have dropped interest rates meaningfully. The combination has raised the risk premium, or the compensation in excess of short-term Treasuries that investors stand to earn from holding stocks, which has essentially lowered the bar for firms ahead of upcoming quarterly earnings reports. The developments bode well for equities as we enter the strongest seasonal period of the calendar, with companies poised to comment positively on their performance, outlooks and the sustainability of the AI expansion, as recent economic data have strengthened evidence of a robust growth environment. Meanwhile, there’s plenty of room for cheaper oil prices and much lower yields stemming from a potential relaxation in geopolitical tensions, which if together with resilient profitability and buoyant capital expenditures, would spark a momentous rally into year-end.
International Roundup
Canadian Inflation Accelerates
Inflation accelerated in Canada as the September Consumer Price Index (CPI) rose 0.1% month over month (m/m) and 3.1% year over year (y/y), missing expectations by 0.1% on both fronts but rising from August’s -0.1% and 3%. The pressure was driven by the transportation, shelter, household operations, alcohol/tobacco/cannabis, and clothing components seeing charges climb 1.2%, 0.3%, 0.2%, 0.2% and 0.1% m/m. Conversely, the health/personal care and food segments got 0.2% and 0.1% cheaper m/m, while the recreation/education/reading category was unchanged during the period.
Chinese Economy Prints Mixed Results
The global AI expansion has helped Chinese manufacturing activity and overall growth, however, sluggish demand within its borders and suppressed asset valuations remain significant drags. Gross Domestic Product (GDP) expanded 1.2% quarter over quarter (q/q) and 4.5% y/y during the 3-month period ended in September, higher than expectations by 0.1% on both fronts and stronger than the 0.9% and 4.3% from the prior interval. Industrial production supported the beat, expanding 5.5% y/y, above the 5.4% projected and the 5.2% from the previous timespan, as strong export volumes drove loftier factory output. Conversely, fixed asset investment and home prices were incredibly weak, dropping 7.2% y/y on a ytd basis and 2.8% on a traditional y/y calculation. Additionally, a 1/1% y/y retail sales increase was anemic, but better than the 0.5% expected and the 0.4% from the preceding reports. Unemployment fell to 5.2%, meanwhile, despite the consensus looking for an unchanged 5.3%.
New to Interactive Brokers?
Open AccountAlready an Interactive Brokers Client?
Request Trading PermissionDisclosure: Interactive Brokers Affiliate
Information posted on IBKR Campus that is provided by third-parties does NOT constitute a recommendation that you should contract for the services of that third party. Third-party participants who contribute to IBKR Campus are independent of Interactive Brokers and Interactive Brokers does not make any representations or warranties concerning the services offered, their past or future performance, or the accuracy of the information provided by the third party. Past performance is no guarantee of future results.
This material is from IBKR Macroeconomics, an affiliate of Interactive Brokers LLC, and is being posted with its permission. The views expressed in this material are solely those of the author and/or IBKR Macroeconomics and Interactive Brokers is not endorsing or recommending any investment or trading discussed in the material. This material is not and should not be construed as an offer to buy or sell any security. It should not be construed as research or investment advice or a recommendation to buy, sell or hold any security or commodity. This material does not and is not intended to take into account the particular financial conditions, investment objectives or requirements of individual customers. Before acting on this material, you should consider whether it is suitable for your particular circumstances and, as necessary, seek professional advice.






Join The Conversation
If you have a general question, it may already be covered in our FAQs page. go to: IBKR Ireland FAQs or IBKR U.K. FAQs. If you have an account-specific question or concern, please reach out to Client Services: IBKR Ireland or IBKR U.K..
Visit IBKR U.K. Open an IBKR U.K. Account