










Traders’ spirits seemed to be improving after yesterday’s earnings report from Nvidia (NVDA). While many of the key existential questions surrounding the company were sidestepped, the solid data and reasonably encouraging conference call seemed to assuage some fears, if not offer some outright confidence. NVDA’s modest post-earnings bounce led to higher prices for other tech shares and broader index futures. That enthusiasm was squelched shortly after stocks opened at 9:30 ET. Someone is selling the rally.
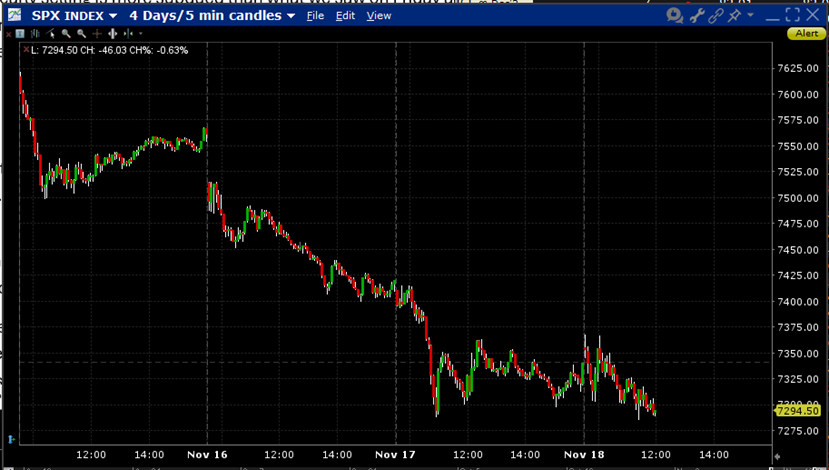
Today’s move should be discouraging for bulls. This is the fourth day in a row when pre-market futures offered little indication that the S&P 500 (SPX) would sink shortly after the bell rang. Today’s early selling is more subdued than what we saw on Friday and yesterday, when the initial drops were somewhat precipitous before stocks stabilized by roughly 11 AM ET. Hopefully it won’t transpire similarly to Monday, when stocks drifted lower throughout the session. Deciding which negative recent precedent may best apply is not encouraging for those hoping for a turnaround, though SPX continues to find support around the 7,300 level.
SPX, 4 Days, 5 Minute Candles
Source: Interactive Brokers – Past performance is not indicative of future performance.
One key difference in today’s activity is that the Nasdaq 100 (NDX) is outperforming SPX. Only three of eleven SPX sectors are rising today, but one of them, communications, is tech related. The other two are consumer discretionary, the top performer, and utilities, which, like communications, is barely in positive territory.
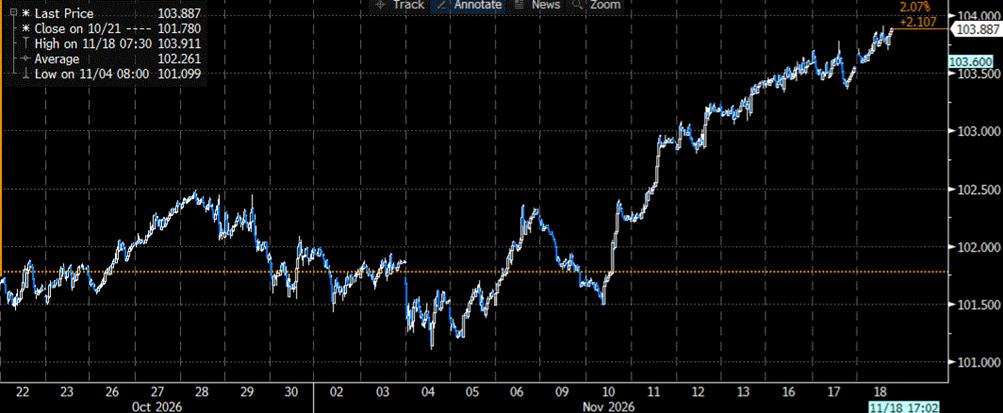
Energy is by far the worst sector today as oil futures sank despite some renewed skirmishes in the Persian Gulf. Commodities markets are mostly lower today, partly thanks to concerns about ongoing demand, and partly because of the dollar’s recent strength. The higher expectations for rate hikes that arose after last week’s CPI report have boosted the dollar versus other currencies. Remember, a stronger dollar means that fewer of them are required to buy a given amount of a commodity. Since most widely followed commodities are priced in USD, they can move inversely to an index like the U.S. Dollar Index (USDX, DXY).
DXY Index, 1 Month, 30 Minute Candles
Source: Bloomberg – Past performance is not indicative of future performance.
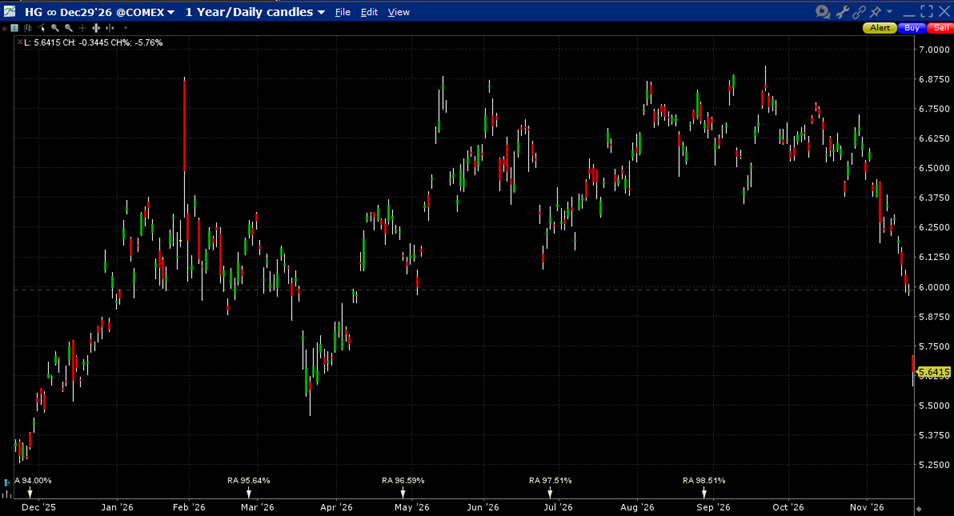
In the case of copper, however, the dollar is far from the main factor influencing prices. Increasing rate hike expectations also weigh on expectations for economic activity. Copper rose sharply as investors focused on its role in building AI data centers, but since then, as enthusiasm for AI has faded, we now see “Dr. Copper,” a classic economic bellwether, flirting with its lows for the year.
Rolling Front-Month Copper Futures, 1 Year, Daily Candles
Source: Interactive Brokers – Past performance is not indicative of future performance.
The recent change in market trends has brought about a necessary change in many traders’ tactics. For the past several years, we have largely forgotten about “sell the rally,” the far less charismatic counterpart to “buy the dip.” There is good reason for it. “Buy the dip” has been a very reliable technique for most traders because it works exceptionally well during bull markets. In those periods, which have prevailed with only short interruptions since 2009, declines in a wide variety of stocks, and the market as a whole, have been relatively fleeting. Positive trends prevailed, and as long as they remained in place, they offered generally reliable opportunities to profit when dips in stocks and indexes occurred.
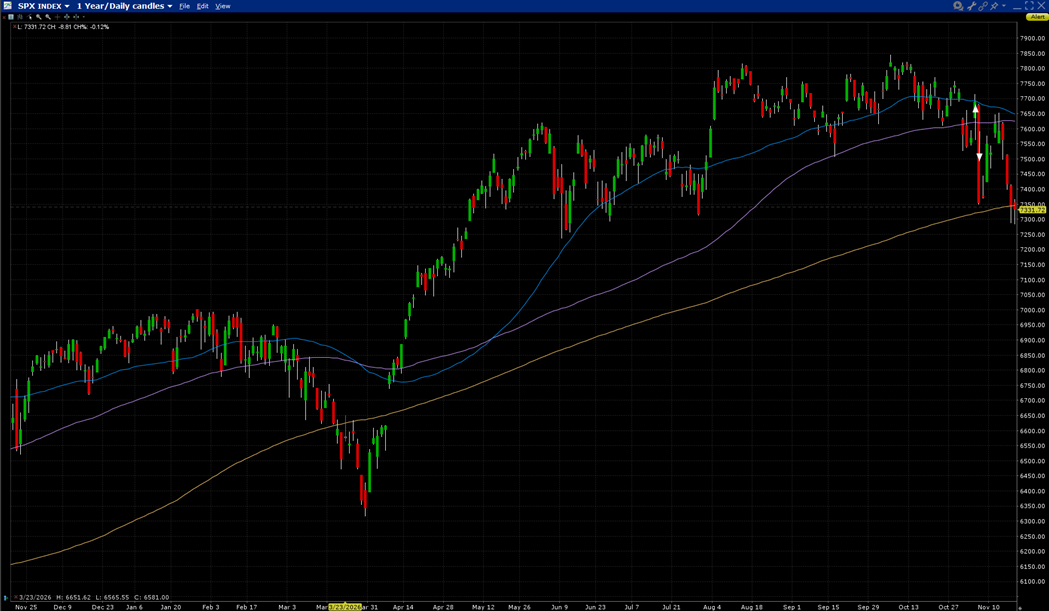
When trends turn south, however, the opposite strategy of selling rallies tends to be a more profitable one. Yet there are several reasons why it tends to work less reliably than dip buying. As we noted above, trends have tended to prevail. Even now, when it is apparent that someone (presumably institutions, perhaps foreign-based) is out there selling rallies, longer-term trends remain upward-sloping. The 50-day moving average has just begun to turn lower, while the 100- and 200-day moving averages continue to point higher.
SPX, 1 Year, Daily Candles, with 50- (blue), 100- (purple), and 200-day (yellow) Moving Averages
Source: Interactive Brokers – Past performance is not indicative of future performance.
As we noted above, SPX seems to be finding support around the 7,300 level. Not coincidentally, that is just below the 200-day moving average. If that level holds, it would reaffirm the positive trend that has prevailed for the better part of four years. And as the chart below shows, stocks can withstand a temporary breach of that key trendline. Thus, just because many large investors appear to be selling rallies right now, it is far from clear that it is the best strategy for all traders at this time.
SPX, 5 Years, Daily Candles, with 50- (blue), 100- (purple), and 200-day (yellow) Moving Averages

Source: Interactive Brokers – Past performance is not indicative of future performance.
New to Interactive Brokers?
Open AccountAlready an Interactive Brokers Client?
Request Trading PermissionDisclosure: Interactive Brokers
The analysis in this material is provided for information only and is not and should not be construed as an offer to sell or the solicitation of an offer to buy any security. To the extent that this material discusses general market activity, industry or sector trends or other broad-based economic or political conditions, it should not be construed as research or investment advice. To the extent that it includes references to specific securities, commodities, currencies, or other instruments, those references do not constitute a recommendation by IBKR to buy, sell or hold such investments. This material does not and is not intended to take into account the particular financial conditions, investment objectives or requirements of individual customers. Before acting on this material, you should consider whether it is suitable for your particular circumstances and, as necessary, seek professional advice.
The views and opinions expressed herein are those of the author and do not necessarily reflect the views of Interactive Brokers, its affiliates, or its employees.






Join The Conversation
If you have a general question, it may already be covered in our FAQs page. go to: IBKR Ireland FAQs or IBKR U.K. FAQs. If you have an account-specific question or concern, please reach out to Client Services: IBKR Ireland or IBKR U.K..
Visit IBKR U.K. Open an IBKR U.K. Account