


Originally posted, 6 February 2025 – Green Macro Newsletter February 2025: EV tariff war and developments in carbon pricing policies
Schroders’ quarterly briefing on the economic impact of climate change, the energy transition and natural capital.
Welcome to the quarterly Green Macro Newsletter, where we present recent news, internal and external research on topics covering the economic impact of climate change, green energy transition, and natural capital.
In this newsletter we focus on recent developments in carbon pricing policies, electric vehicle tariffs, and look at the possible impacts of the Trump administration’s decision to withdraw from the Paris Climate Agreement, again.
In the news
The EU CBAM is encouraging the EU’s trade partners to adopt carbon pricing policies
The EU Carbon Border Adjustment Mechanism (CBAM) is a tariff that targets “carbon leakage” in offshore production of imported goods, applying a carbon price to imported goods that is equivalent to the carbon price applied to goods manufactured in the EU. The CBAM will start to be implemented in January 2026, but it is already having the intended effect of spreading carbon pricing to other countries.
Several countries are developing their own domestic carbon pricing scheme in order to retain revenues domestically by reducing their ‘CBAM bill’. In December, Brazil passed a law to cap greenhouse gas emissions from companies and set up a nationwide system to trade carbon credits. The legislation creates the Brazilian emissions trading system (SBCE) and stipulates that companies with over 25,000 metric tonnes/yr of emissions will be subject to the cap-and-trade system. According to a study by think tank ICC Brasil, Brazil has the potential to generate up to $100bn in revenues from the carbon market by 2030.
The CBAM is acting as a key driver for adopting carbon pricing schemes in some Asian countries too, including Singapore, Taiwan, and Japan. The Japanese industry ministry has stated that companies that emit more than 100,000 tons of carbon dioxide annually will be required to participate in the government’s carbon emissions trading system, set to take effect in fiscal 2026. The program is expected to apply to between 300 and 400 companies, mainly in the steel, electricity, aviation, logistics, and food manufacturing sectors.
Our view: We believe that we will see more carbon pricing schemes implemented globally, as other developed countries look to mirror the EU and adopt their own carbon border tax. The UK Government has recently confirmed that it will implement a CBAM by 2027, applying a charge on the carbon emissions embodied in imports from key sectors, including aluminium, cement, fertilisers, hydrogen, and iron and steel sectors. This formation of a “carbon club” means that additional pressure will be exerted on key exporting countries to raise their domestic carbon pricing schemes. Carbon taxes and pricing systems provide funds for governments while encouraging companies to adopt low-carbon technologies and innovate towards greener production methods. Rising carbon prices are likely to increase inflationary pressures, especially for those countries heavily reliant on fossil fuels as a source of energy production.
The EU imposes tariffs on Chinese electric vehicle (EV) imports
The European Commission concluded its anti-subsidy investigation by imposing definitive tariffs on imports of battery electric vehicles (BEVs) from China, effective for a period of five years. This investigation was prompted by a dramatic increase in trade flows. The EU accounts for almost 40% of Chinese exports of EVs and the region represents their top destination. Chinese EV exports to the region rose 37% year-on-year in 2023 to $13bn. Findings revealed that the BEV value chain in China is significantly supported by state subsidies, which distorts competition and poses a potential threat to the EU’s automotive industry. The countervailing duties imposed vary according to car brands, ranging from 7.8% for Tesla to 35.3% for SAIC, reflecting the differing levels of subsidy applicable to each manufacturer.
Our view: By imposing these tariffs, the European Commission intends to establish a fair competitive environment for both Chinese and EU car manufacturers. However, analysis by Rhodium group indicates that most Chinese producers are likely capable of absorbing these costs to maintain their market share. A number of Chinese EV models may still benefit from a strong profit premium in the EU, as more substantial tariffs of 55% on competitive brands like BYD would be necessary to make exports financially unattractive.
The move is also not likely to bolster the European car industry. Europe’s battery supply chain is facing structural pressures, such as lack of innovation and high energy prices. While protective tariffs might offer short-term relief, they do not address the root causes of the growing competitiveness gap between Europe and China. While some retaliatory tariffs may arise, we do not expect a significant escalation in trade policy as the EU remains a critical market for Chinese exports.
Trump withdraws from the Paris Agreement again
On his first day back as president, Trump signed an executive order directing the US to exit the Paris Agreement on global warming. This marked the second time Trump had taken this step, having previously announced the US withdrawal from the accord during his first term in 2017. Trump also issued another order that directs federal agencies to pause disbursements of certain funds under the Inflation Reduction Act (IRA) and the Infrastructure Investment and Jobs Act (IIJA) of 2021. Agencies must suspend loans, and other financial mechanisms, including those supporting electric vehicle infrastructure, until they complete a 90-day review to ensure alignment with the administration’s energy policy.
Our view: Trump’s policies will once again undermine the US commitment to global climate efforts and could potentially create some headwinds for the fight against climate change. However, the affordability and efficiency of renewable energy sources will keep pushing the move towards a low-carbon economy. Market forces and actions at state level will continue to play a critical role in supporting green energy expansion. Wind and solar energy are poised to keep adding power capacity as their prices are now competitive with fossil fuels.
Los Angeles wildfires are set to be the costliest climate disaster in US history
Recent estimates of the economic damages from the wildfires in Los Angeles suggest that they are expected to be the most expensive climate disaster in US history, with costs exceeding those inflicted by Hurricane Katrina in 2005 by more than $50 billion.
Inflation-adjusted estimates of climate damages
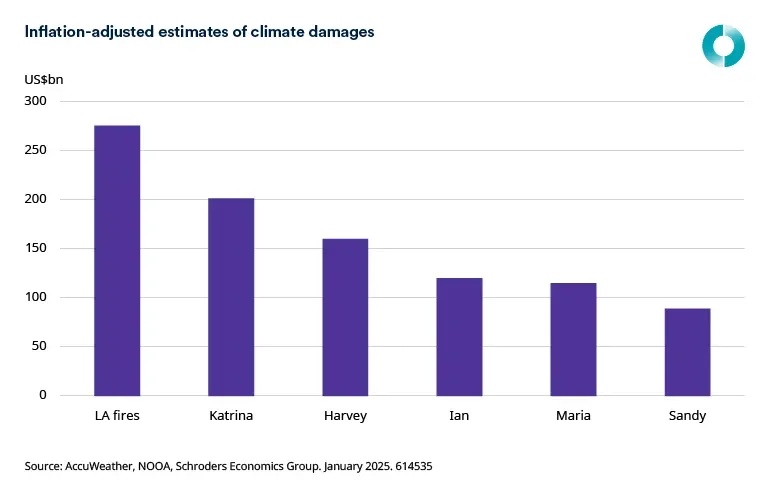
Source: AccuWeather, NOOA, Schroders Economics Group. January 2025.
Our view: As the wildfires in Los Angeles have primarily affected residential areas, without disrupting business operations and employment, the impact on GDP is expected to be minimal. However, the consequences for households should not be overlooked. Increasingly frequent and severe weather events have led to a rise in insurance claims. In several states, insurers have reported declining profits on homeowners’ insurance due to significant losses from wildfires, floods, and storms. In response to these losses, many insurers have raised premiums, limited coverage, dropped customers, and even withdrawn entirely from some markets. This trend has been observed in California, where wildfires are common, as well as in Florida and Louisiana due to flood risks. As a result, higher insurance rates are causing financial strain for many homeowners. Rising housing costs are likely to reduce household spending while exerting downward pressure on house prices in markets that are particularly vulnerable to climate events.
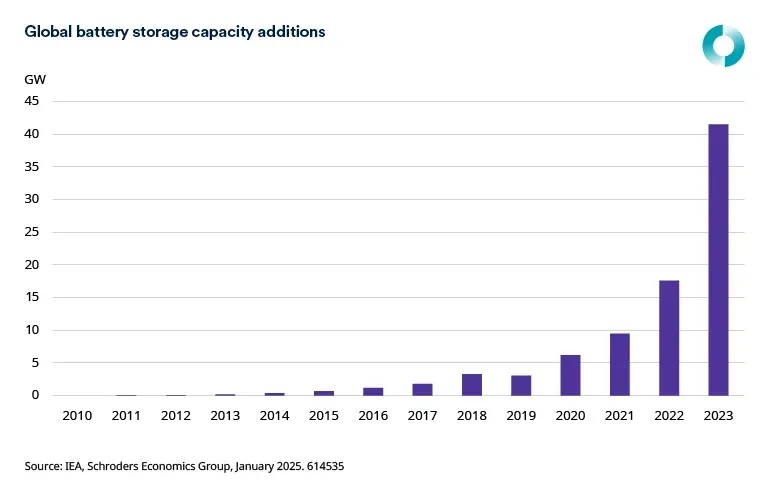
Battery storage is on the run
Over the past decade, global installed battery storage capacity has risen dramatically, increasing from approximately 1 gigawatt (GW) in 2013 to over 85 GW in 2023. Notably, more than 40 GW were added in 2023 alone, more than doubling the additions seen in 2022.
Global battery storage capacity additions
Past performance is not indicative of future results.
Source: IEA, Schroders Economics Group, January 2025
China has emerged as the leading market for battery storage in recent years, with its share of global annual additions increasing from around 20% in 2019 to 55% in 2023. Capacity additions surged to 23 GW in 2023, tripling from previous years. Approximately two-thirds of this new capacity was utility-scale, driven primarily by provincial mandates requiring that new solar PV or wind power projects be paired with energy storage.
The US stands as the second-largest market for battery storage, with additions reaching over 8 GW in 2023. Nearly 90% of the additional capacity came from utility-scale projects, with states like California and Texas leading the deployment efforts. This growth has been mainly supported by investment tax credit introduced under the Inflation Reduction Act.
Our view: Batteries are a key component of the global energy system today and are poised to play a critical role in facilitating secure and clean energy transitions. In the power sector, storage improves energy security by supporting grid stability, meeting peak loads, and facilitating the integration of increasing shares of variable renewable energy sources while also reducing fossil fuel demand across multiple sectors. According to the IEA, from 2010 to 2023, their average costs decreased by 90%, making them a competitive source of flexibility in the power sector. A surge in manufacturing capacity is contributing to the decline in prices, further supporting the goal of tripling the installed capacity of renewables globally.
Our economic sustainability publications
Long-run asset class performance: 30-year return forecasts (2025–54)
- This year, we anticipate higher returns across various asset classes, both in real and nominal terms, especially within the fixed income markets. At the global level, our forecast for equity returns has increased due to stronger expected returns in developed markets, particularly in the US.
- Our central case is the Delayed Transition scenario, where there is a disorderly transition to net-zero with carbon pricing only starting to rise from 2030.
- We find that most countries experience higher productivity in our central scenario, as they benefit from transitioning to a cleaner economy, avoiding the impacts of higher temperatures.
External economic sustainability research
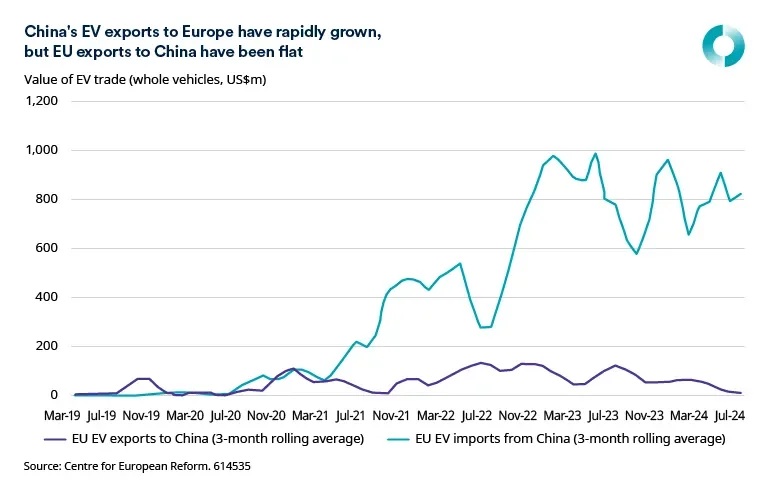
How German industry can survive the second China shock, Centre for European Reform
- Recent analysis shows that while the EU is lagging in solar panels and EV batteries, the bloc, led by Germany, still maintains a strong production base and competitive advantage in a broader range of clean energy technologies. The IMF has a list of over 200 “low-carbon technology” (LCT) goods., These are technologies that produce fewer greenhouse gas emissions over their lifetime than traditional options. This list includes items like electric vehicles, heat pumps, electrolysers, various turbines, nuclear centrifuges, and common technologies like insulation and thermostats.
- Supported by a strong industrial policy, China has gained a dominant share of the global clean tech market. This policy has created challenges for exports from other countries to compete in China, while many strong Chinese companies try to find new markets abroad, to avoid tough competition at home. This trend is particularly evident in the electric vehicle and solar panel sectors, where China’s overcapacity has put significant downward pressure on prices and profit margins, especially for German producers.
- Now, Chinese industrial policy is expanding beyond just the EV and solar value chain as the country now appears to be reducing its imports of all low-carbon technologies. This shift represents a clear threat for Europe’s industrial base.
- The EU currently lacks adequate common funding for an ambitious industrial policy. Nevertheless, it can tighten single market regulations to ensure alignment among member countries regarding national subsidies, potentially linking these subsidies to environmental and labour standards that China does not meet.
China’s EV exports to Europe have rapidly grown, but EU exports to China have been flat
Past performance is not indicative of future results.
Source: Centre for European Reform
What’s coming up
EU Clean Industrial Deal
• The European Commission is expected to present the Clean Industrial Deal at the end of February. This long-term plan aims to boost the bloc’s competitiveness by supporting emerging cleantech manufacturing in line with its decarbonisation goals.
• Additionally, the forthcoming industrial decarbonisation strategy is likely to focus on six key pillars: energy security and energy prices, financing, recycling and critical raw materials, labour and skills, lead markets, and global action.
Disclosure: Schroders
Important Information: This communication is marketing material. The views and opinions contained herein are those of the author(s) on this page, and may not necessarily represent views expressed or reflected in other Schroders communications, strategies or funds. This material is intended to be for information purposes only and is not intended as promotional material in any respect. The material is not intended as an offer or solicitation for the purchase or sale of any financial instrument. It is not intended to provide and should not be relied on for accounting, legal or tax advice, or investment recommendations. Reliance should not be placed on the views and information in this document when taking individual investment and/or strategic decisions. Past performance is not a reliable indicator of future results. The value of an investment can go down as well as up and is not guaranteed. All investments involve risks including the risk of possible loss of principal. Information herein is believed to be reliable but Schroders does not warrant its completeness or accuracy. Some information quoted was obtained from external sources we consider to be reliable. No responsibility can be accepted for errors of fact obtained from third parties, and this data may change with market conditions. This does not exclude any duty or liability that Schroders has to its customers under any regulatory system. Regions/ sectors shown for illustrative purposes only and should not be viewed as a recommendation to buy/sell. The opinions in this material include some forecasted views. We believe we are basing our expectations and beliefs on reasonable assumptions within the bounds of what we currently know. However, there is no guarantee than any forecasts or opinions will be realized. These views and opinions may change. Schroder Investment Management North America Inc. is a SEC registered adviser and indirect wholly owned subsidiary of Schroders plc providing asset management products and services to clients in the US and Canada. Interactive Brokers and Schroders are not affiliated entities. Further information about Schroders can be found at www.schroders.com/us. Schroder Investment Management North America Inc. 7 Bryant Park, New York, NY, 10018-3706, (212) 641-3800.
Disclosure: Interactive Brokers Third Party
Information posted on IBKR Campus that is provided by third-parties does NOT constitute a recommendation that you should contract for the services of that third party. Third-party participants who contribute to IBKR Campus are independent of Interactive Brokers and Interactive Brokers does not make any representations or warranties concerning the services offered, their past or future performance, or the accuracy of the information provided by the third party. Past performance is no guarantee of future results.
This material is from Schroders and is being posted with its permission. The views expressed in this material are solely those of the author and/or Schroders and Interactive Brokers is not endorsing or recommending any investment or trading discussed in the material. This material is not and should not be construed as an offer to buy or sell any security. It should not be construed as research or investment advice or a recommendation to buy, sell or hold any security or commodity. This material does not and is not intended to take into account the particular financial conditions, investment objectives or requirements of individual customers. Before acting on this material, you should consider whether it is suitable for your particular circumstances and, as necessary, seek professional advice.
Disclosure: Futures Trading
Futures are not suitable for all investors. The amount you may lose may be greater than your initial investment. Before trading futures, please read the CFTC Risk Disclosure. A copy and additional information are available at the Warnings and Disclosures section of your local Interactive Brokers website.
Disclosure: ETFs
Any discussion or mention of an ETF is not to be construed as recommendation, promotion or solicitation. All investors should review and consider associated investment risks, charges and expenses of the investment company or fund prior to investing. Before acting on this material, you should consider whether it is suitable for your particular circumstances and, as necessary, seek professional advice.


Join The Conversation
If you have a general question, it may already be covered in our FAQs page. go to: IBKR Ireland FAQs or IBKR U.K. FAQs. If you have an account-specific question or concern, please reach out to Client Services: IBKR Ireland or IBKR U.K..
Visit IBKR U.K. Open an IBKR U.K. Account