1/ Market Trend Model Confirms Bullish Trend
2/ Newer Dow Theory Flashes Bearish Non-Confirmation
3/ Bullish Percent Index Reaching Euphoric Levels
Investopedia is partnering with CMT Association on this newsletter. The contents of this newsletter are for informational and educational purposes only, however, and do not constitute investing advice. The guest authors, which may sell research to investors, and may trade or hold positions in securities mentioned herein do not represent the views of CMT Association or Investopedia. Please consult a financial advisor for investment recommendations and services.
1/
Market Trend Model Confirms Bullish Trend
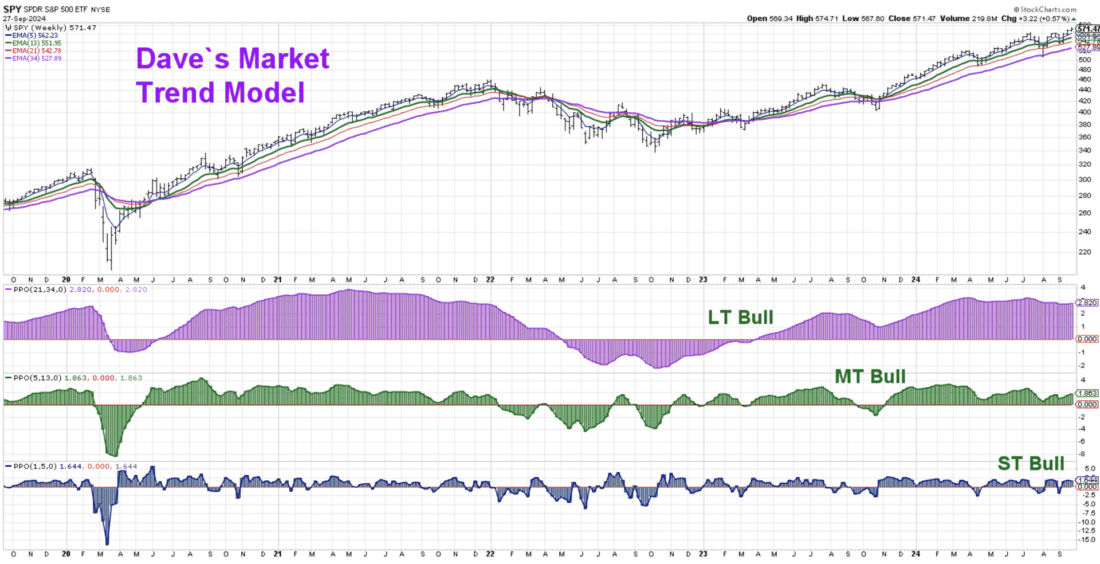
As a trend-follower, my three goals at any given point are to identify trends, to follow those trends, and to look for signs that the trends are exhausted. Our Market Trend Model, based on weekly exponential moving averages, is to help us define the broad market trend on three different time frames.
For my investment process, “short-term” represents a couple days to a couple weeks, “medium-term” means a couple months, and “long-term” suggests over a year. And by defining the trends on these three time frames every week after the Friday close, I can better understand the macro environment within which I’m trying to outperform.
Courtesy of StockCharts.com
Past performance is not indicative of future results
Our long-term model has been bullish since April 2023, and the medium-term model turned bullish in November 2023 after the October low. The short-term model has turned negative three times so far in 2024, helping to confirm the pullbacks in April, July, and August.
Last Friday represents the third straight week where our Market Trend Model has been bullish on all three timeframes. For me, this is a clear “permission to buy” indication, because if the trends are positive, then I want to be following those uptrends for as long as possible!
2/
Newer Dow Theory Flashes Bearish Non-Confirmation
While the broad market trend remains positive heading into Q4, it’s important to look for any sort of contrarian evidence that could suggest an end to the bullish phase. Charles Dow favored using the Dow Industrials and Dow Railroads as a way to measure the strength of the producers of goods and the distributors of goods.
If both indexes are making new highs, according to Dow, then the market trend is positive because both pillars of the economy are thriving. When one index makes a new high and the other does not, that would mean a “bearish non-confirmation” and a potential topping signal.
Courtesy of StockCharts.com
Past performance is not indicative of future results
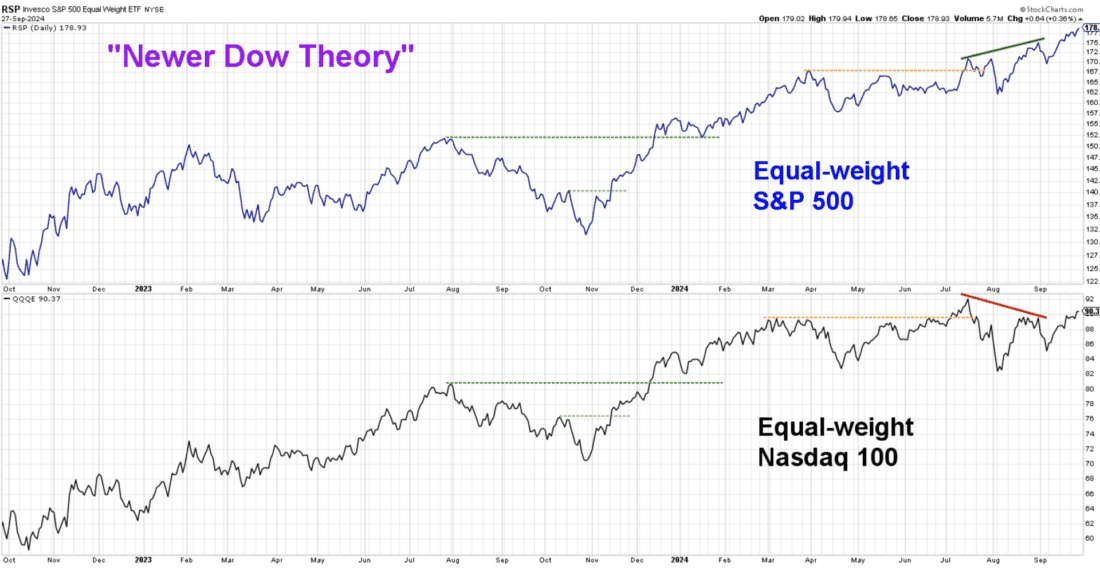
To modernize Dow’s original work, and make it more relevant to the structure of the economy in 2024, I’m using the S&P 500 to represent the “old economy” names, and the Nasdaq 100 as a proxy for the “new economy” stocks. I’m using equal-weighted ETFs to try and minimize the dominance of the mega cap growth stocks which represent huge weights in both indexes.
In July and August, the equal-weighted S&P 500 made a new all-time high, but this breakout was not confirmed by the equal-weighted Nasdaq 100. This suggests a bearish non-confirmation, a signal which has been common at previous major market tops. We have seen a resurgence in semiconductors and other technology stocks in late September, so a breakout in the Nasdaq 100 over the coming weeks could negate this potential bearish signal from what I call the “Newer Dow Theory.”
3/
Bullish Percent Index Reaching Euphoric Levels
Breadth conditions are an important piece of my investment process, as they allow you to look “under the hood” of the markets to measure participation of the individual stocks that comprise the benchmarks.
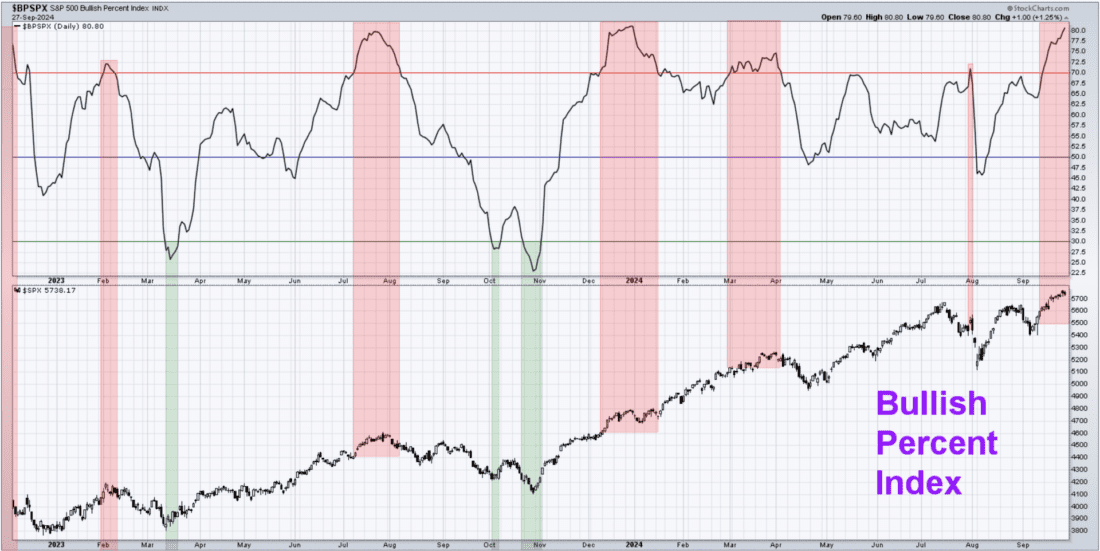
The S&P 500’s Bullish Percent Index essentially looks at 500 individual point & figure charts, telling us what percent of the benchmark members are currently showing a bullish signal on their own charts. And as with many other oscillators in the technical analysis toolkit, we’re looking for extreme readings.
Courtesy of StockCharts.com
Past performance is not indicative of future results
As of the end of last week, just over 80% of the S&P 500 members were showing a buy signal on their point & figure chart. Any reading above 70 is considered “euphoric” in my methodology, which means I’m now looking for a break below the overbought level to confirm a likely tactical pullback.
I’ve highlighted extreme bullish readings in red, which help to demonstrate how the euphoric readings usually come right before a major market top. One notable exception was in January 2024, when the strength in the Magnificent 7 names propelled the S&P 500 higher despite the weaker breadth readings.
For now, I’m waiting for this indicator to dip back below the crucial 70 level, which would suggest that the strength we’ve observed into the end of Q3 may lead to a more painful October than many investors expect.
—-
Originally posted 30th September 2024
Disclosure: Investopedia
Investopedia.com: The comments, opinions and analyses expressed herein are for informational purposes only and should not be considered individual investment advice or recommendations to invest in any security or to adopt any investment strategy. While we believe the information provided herein is reliable, we do not warrant its accuracy or completeness. The views and strategies described on our content may not be suitable for all investors. Because market and economic conditions are subject to rapid change, all comments, opinions and analyses contained within our content are rendered as of the date of the posting and may change without notice. The material is not intended as a complete analysis of every material fact regarding any country, region, market, industry, investment or strategy. This information is intended for US residents only.
Disclosure: Interactive Brokers Third Party
Information posted on IBKR Campus that is provided by third-parties does NOT constitute a recommendation that you should contract for the services of that third party. Third-party participants who contribute to IBKR Campus are independent of Interactive Brokers and Interactive Brokers does not make any representations or warranties concerning the services offered, their past or future performance, or the accuracy of the information provided by the third party. Past performance is no guarantee of future results.
This material is from Investopedia and is being posted with its permission. The views expressed in this material are solely those of the author and/or Investopedia and Interactive Brokers is not endorsing or recommending any investment or trading discussed in the material. This material is not and should not be construed as an offer to buy or sell any security. It should not be construed as research or investment advice or a recommendation to buy, sell or hold any security or commodity. This material does not and is not intended to take into account the particular financial conditions, investment objectives or requirements of individual customers. Before acting on this material, you should consider whether it is suitable for your particular circumstances and, as necessary, seek professional advice.
Disclosure: ETFs
Any discussion or mention of an ETF is not to be construed as recommendation, promotion or solicitation. All investors should review and consider associated investment risks, charges and expenses of the investment company or fund prior to investing. Before acting on this material, you should consider whether it is suitable for your particular circumstances and, as necessary, seek professional advice.
Disclosure: Futures Trading
Futures are not suitable for all investors. The amount you may lose may be greater than your initial investment. Before trading futures, please read the CFTC Risk Disclosure. A copy and additional information are available at the Warnings and Disclosures section of your local Interactive Brokers website.







Join The Conversation
If you have a general question, it may already be covered in our FAQs page. go to: IBKR Ireland FAQs or IBKR U.K. FAQs. If you have an account-specific question or concern, please reach out to Client Services: IBKR Ireland or IBKR U.K..
Visit IBKR U.K. Open an IBKR U.K. Account