











An atypical combination of boiling hot economic data paired with plunging yields is supporting today’s notable cyclical trade. The rush to cyclical stocks is occurring as Wall Street is becoming increasingly concerned about everything associated with AI, technology and semiconductors because the risks of potential overinvestment and aggressive debt expansions amidst uncertain capital return prospects have raised slowdown angst while Treasuries catch robust safe-haven bids. Rates have fallen sharply even as today’s scorching September PPI registered the steepest m/m increase in 54 months. The print was accompanied by an upside-beat on retail sales, healthy levels of unemployment claims and surging oil prices that would normally pose headwinds to fixed-income assets. But since investors see vulnerabilities in the credit cycle, heightening contagion possibilities are offsetting the factors that would usually generate a terrible day for bonds. Indeed, default swaps tied to the reliability of future interest payments have illustrated greater risk of delay and/or or outright failure for certain companies, reducing the odds of Fed hikes while raising the chances of a deceleration in activity, although today’s numbers don’t tell that story at all. Traders have rushed in to scoop the harsh morning dip, and the Dow Jones Industrial and Russell 2000 indices are outperforming against that backdrop. In other market areas, the S&P 500 is near its flatline while the Nasdaq 100 is still lower on the session. Seven of the 11 principal sectors are advancing and the yield curve is falling in bull-flattening motion led by duration. It’s taking the greenback down with it. Elsewhere, precious metals, commodities as a whole are experiencing engagement while hedging demand lightens as volatility protection instruments see softer premiums.
PPI Came in Boiling Hot
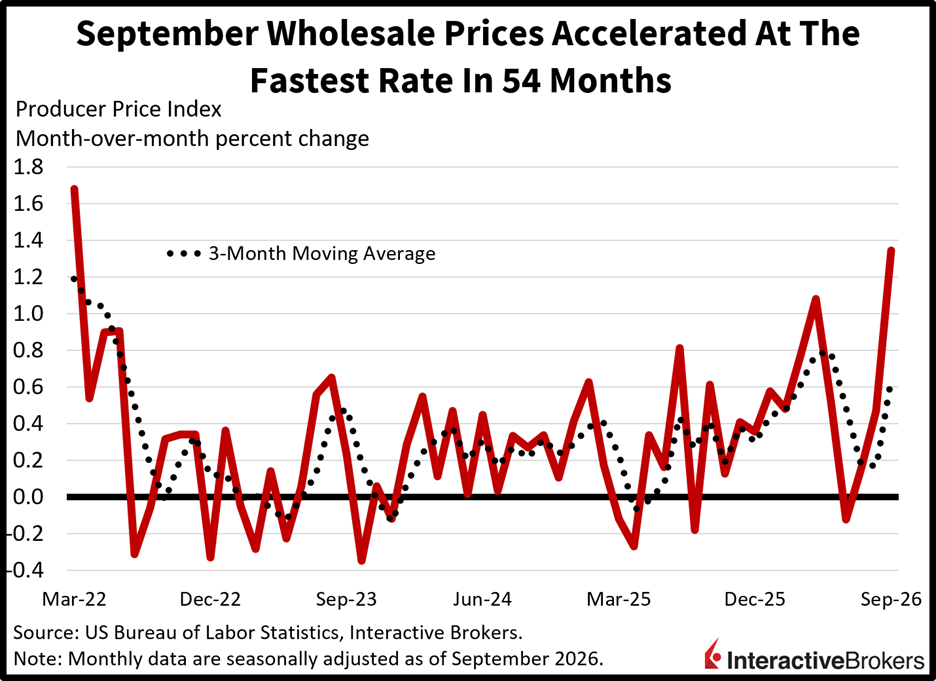
Wholesale inflation hit its fastest monthly rate in more than four years as broad-based cost pressures led by heavier fuel charges generated a meaningful beat in this morning’s release. The September Producer Price Index (PPI) jumped 1.3% month over month and 6.3% year over year (y/y), shattering expectations of 0.5% and 5.5% while jumping from 0.5% and 5.6% in August. Some of the sectors with the strongest price gains and the extent of the m/m changes included the following:
- Energy, 10%
- Transportation/warehousing services, 3.4%
- Trade services, 2.1% and 1.2 m/m
- Food categories, 1.2%
Featuring more modest, albeit still notable, lifts were the core goods and other services segments, with hikes of 0.3% each.
Past performance is not indicative of future results
Retail Sales Beats Too
Consumer spending held up well last month despite sentiment remaining in the basement in response to pain at the pump, elevated inflation, heavy interest rates and geopolitical uncertainty. Retail Sales advanced 0.8% m/m, decelerating modestly’ from August’s 1.3%, but the print was stronger than the 0.3% expected. Because this report doesn’t strip out the impact of prices increases from results, it was no surprise that gasoline sales led transaction momentum with a gain of 6.4% m/m, although those firmer fuel charges didn’t substantially hamper the other categories, which strengthened broadly against the backdrop of resilient households. The following non-fuel sectors and the extent of their sales increases were among the strongest in September:
- Furniture showrooms, 1.3%
- Restaurants/bars, 1.1%
- Health/personal care, 0.7%
- Electronics/appliance destinations, 0.6%
Food and beverage markets, e-commerce, and automobile dealership contributed slightly with m/m growth of 0.4%, 0.3% and 0.2%, respectively. Conversely, apparel stores were flat, while retailers focused on miscellaneous merchandise, building materials, sporting goods and general items saw m/m declines of 3%, 0.6%, 0.5% and 0.1%.
Labor Market Stability Continues
Layoff appetites remained subdued in the past two weeks as depicted by unemployment filings continuing to signal labor market stability. Initial and ongoing unemployment claims were little changed in this morning’s update, arriving at 199k and 1.71 million during the weeks that ended Oct. 10 and 3. The overall figure came in near expectations of 200k and 1.710 million as well as the 198k and the 1.714 million from the prior print. Similarly, four-week moving averages were generally steady at 198.5 and 1.711 million from 198.75k and 1.709 million.
Reasons for Optimism
Wall Street is poised to transition to an optimistic mood as incoming corporate earnings reports dismiss AI overspending concerns as seasonal factors turn positive around mid to late October. Today’s trading is emblematic of investors wanting exposures to cyclical equities that are benefiting from robust economic growth amidst a heavier risk premium stemming from lighter interest rates. The broadening trade has indeed countered weak performance from the AI sector throughout this bull market, and this session is just another example of its ability to bolster the indices when tech isn’t participating. These are the characteristics of a favorable environment for shareholders, as equity participants have a plethora of levers to pull to keep the rally going into year-end and overcome challenges as we flip the calendar.
International Roundup
Payrolls Fall in Australia
Australia’s payrolls contracted substantially in September, but a slight descent in the country’s participation rate helped keep the unemployment rate unchanged at 4.7%. The number of filled positions in September sank by 39.3k when compared to August, defying the economist consensus estimate for an additional 19.6k individuals to join the ranks of the employed. It was also a notable reversal from the 29.3k additions in September.
The losses were focused on part-time workers with the number of full-timers jumping by 34.4k following August’s 4k contraction. Meanwhile, the labor participation rate, or the portion of the working-age population that is either employed or seeking work, fell from 67% in August to 66.8%. Economists anticipated no change.
Despite the decline in active workers, the 4.7% unemployment rate was unchanged because the metric is calculated based on the portion of out-of-work individuals within the total of both job seekers and those who are punching time clocks. A consensus of economists anticipated that the unemployment rate would fall to 4.6%.
South Korea Rides AI Wave to Boost Trade Surplus
South Korea’s trade surplus jumped from $34.7 billion in August to $49.9 billion last month with exports soaring 83.7% y/y. The Economists anticipated that the surplus would only reach $49.8 billion. The country’s shipments abroad were expected to jump 83.5% following the 68.7% climb in August. Imports also strengthened with August’s 22.4% y/y growth accelerating to 26% last month, which matched the economist consensus estimate. The sixteenth consecutive month of export expansion was driven, in large part, by foreign purchases of semiconductors, computers, ships, steel, wired telecommunication devices and petroleum products. Demand for semiconductors and computers continued to gain support from the global buildout of data warehouse and AI.
Automobile volumes didn’t share in the success with foreign customers slashing their demand by 5.6%. The US, Canada, Australia and Germany were among the larger countries that bucked the trend with purchases climbing 7.8%, 14.4%, 19% and 67.9%.
UK GDP Results Are Mixed
Gross domestic product in the UK slowed on a m/m basis in August but its y/y pace accelerated from July’s results, according to an estimate from the Office for National Statistics. After expanding 0.4% m/m in July, GDP was up only 0.1% in August. Even with the deceleration, the reading still surpassed the economist consensus forecast for a 0.1% contraction. GDP, furthermore, was up 2.1% from the year-ago period, outpacing the economist consensus estimate of 1.7% and September’s 1.8% result. The monthly rate faced the headwind of construction output dropping 0.2%. Conversely, production grew 0.8% while the services sector was flat.
New to Interactive Brokers?
Open AccountDisclosure: Interactive Brokers Affiliate
Information posted on IBKR Campus that is provided by third-parties does NOT constitute a recommendation that you should contract for the services of that third party. Third-party participants who contribute to IBKR Campus are independent of Interactive Brokers and Interactive Brokers does not make any representations or warranties concerning the services offered, their past or future performance, or the accuracy of the information provided by the third party. Past performance is no guarantee of future results.
This material is from IBKR Macroeconomics, an affiliate of Interactive Brokers LLC, and is being posted with its permission. The views expressed in this material are solely those of the author and/or IBKR Macroeconomics and Interactive Brokers is not endorsing or recommending any investment or trading discussed in the material. This material is not and should not be construed as an offer to buy or sell any security. It should not be construed as research or investment advice or a recommendation to buy, sell or hold any security or commodity. This material does not and is not intended to take into account the particular financial conditions, investment objectives or requirements of individual customers. Before acting on this material, you should consider whether it is suitable for your particular circumstances and, as necessary, seek professional advice.
Disclosure: Precious Metals
Precious metals may not be available in all locations, please check your local IBKR website for availability.





Join The Conversation
If you have a general question, it may already be covered in our FAQs page. go to: IBKR Ireland FAQs or IBKR U.K. FAQs. If you have an account-specific question or concern, please reach out to Client Services: IBKR Ireland or IBKR U.K..
Visit IBKR U.K. Open an IBKR U.K. Account