


Originally Posted 05 Dec 2024 – https://www.cmegroup.com/insights/economic-research/2024/coppers-crosscurrents-could-energize-options-implied-volatility-in-2025.html
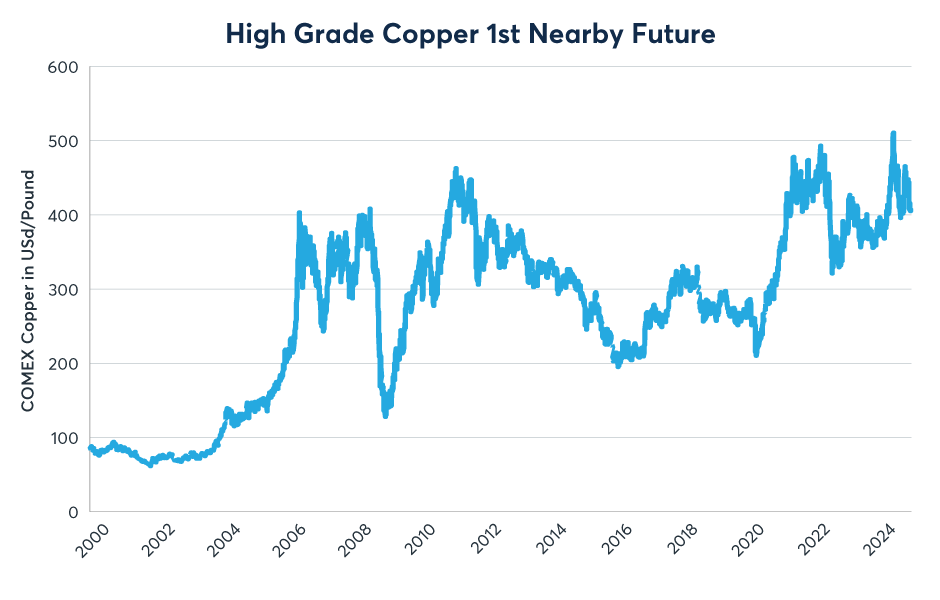
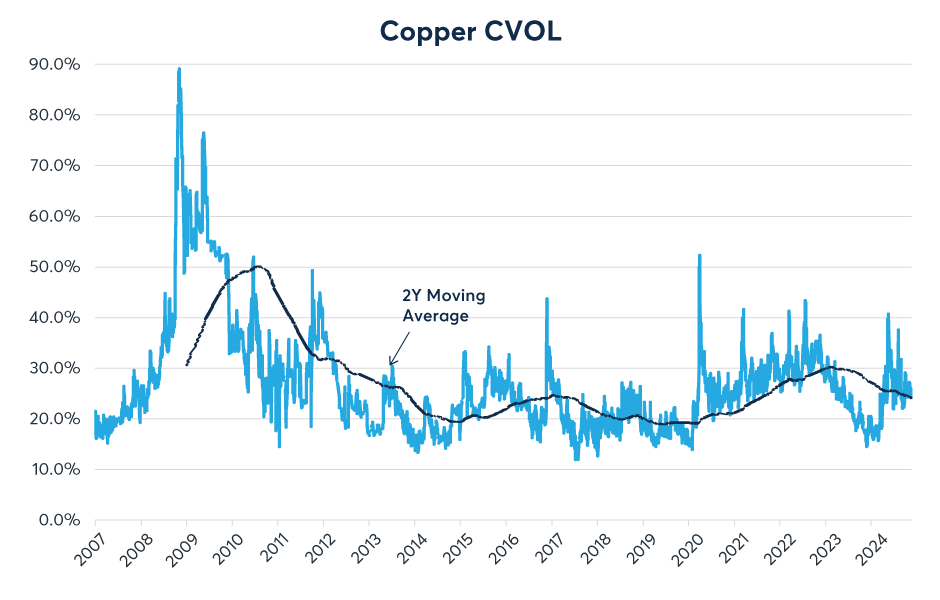
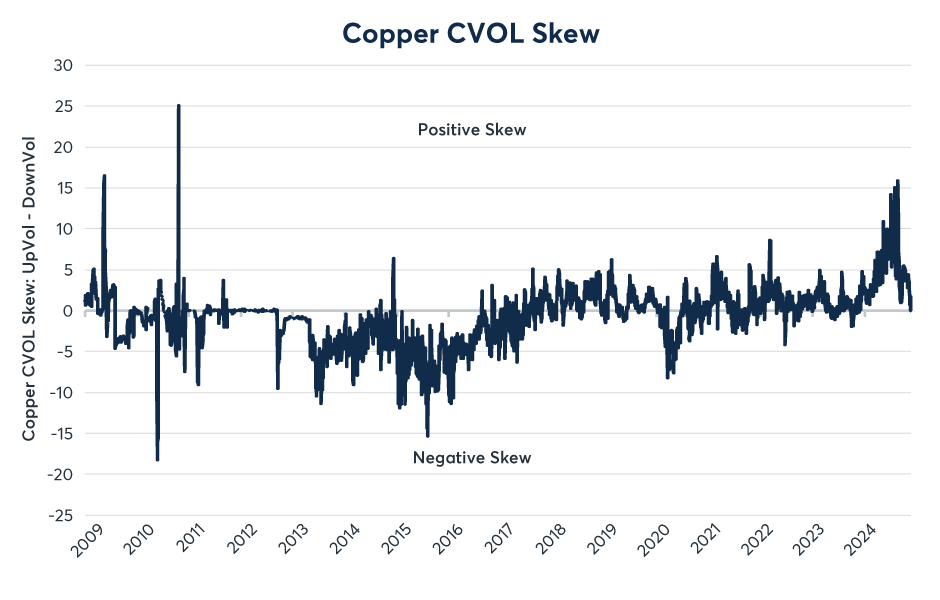
COMEX copper prices surged in early 2024, hitting a record high of $5. 17 per lb as strong energy-transition related demand collided with slow growth in supply (Figure 1). During this time, implied volatility rose and the volatility “smile” skewed positive as the prices of call options rose relative to puts. The positive skew, however, turned out to be a bearish indicator and copper prices slid during the second half of the year. As copper prices fell, implied volatility moderated on CME’s comprehensive CVOL index and the positive skew in options disappeared by mid-November (Figures 2 and 3).
Figure 1: Copper prices rallied to a record high in May and have retreated since
Past performance is not indicative of future results.
Figure 2: Copper options implied volatility as measured by CVOL is close to average levels
Past performance is not indicative of future results.
Figure 3: Copper CVOL skew has declined toward neutral in the wake of the recent price correction
Past performance is not indicative of future results.
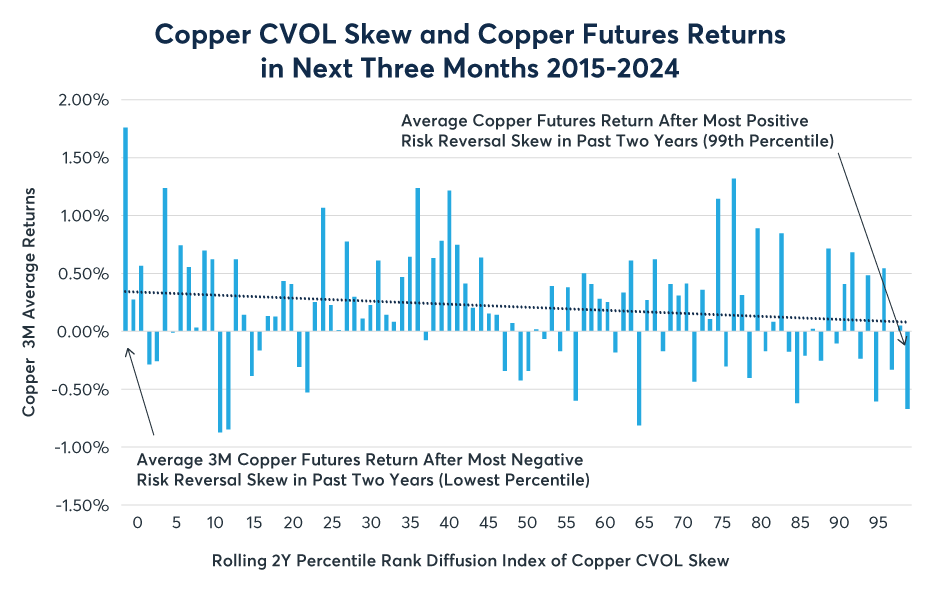
The skew in copper options has historically been a decent contrary indicator of future movements in the spot price of copper. If one creates a diffusion index for copper options skew, where a reading of zero implies that copper options’ implied volatility is the most negatively skewed it has been for the past two years, and a reading of 100 implies that it’s the most positively skewed that it has been for the past two years, and compares it to the subsequent three-month return of the futures contract, one finds an inverse relationship (Figure 4). In this case, the extreme positive skew in May foreshadowed a coming correction.
Figure 4: More negative-than-usual skew in copper options is often followed by bull markets
Past performance is not indicative of future results.
Forthcoming policy initiatives in the U.S. may have contributed to copper’s decline, given the possibility of less investment in the energy transition and a potential end to the $7,500 tax credit for buying electric vehicles. That said, demand remains robust elsewhere. In China, for example, EV sales rose to 50% of new car sales in 2024 from 35% in 2023. Moreover, copper supply remains heavily constrained, having grown at a pace of about 1% per year over the last decade (Figure 5).
Figure 5: Mining supply of copper has barely grown since 2014.
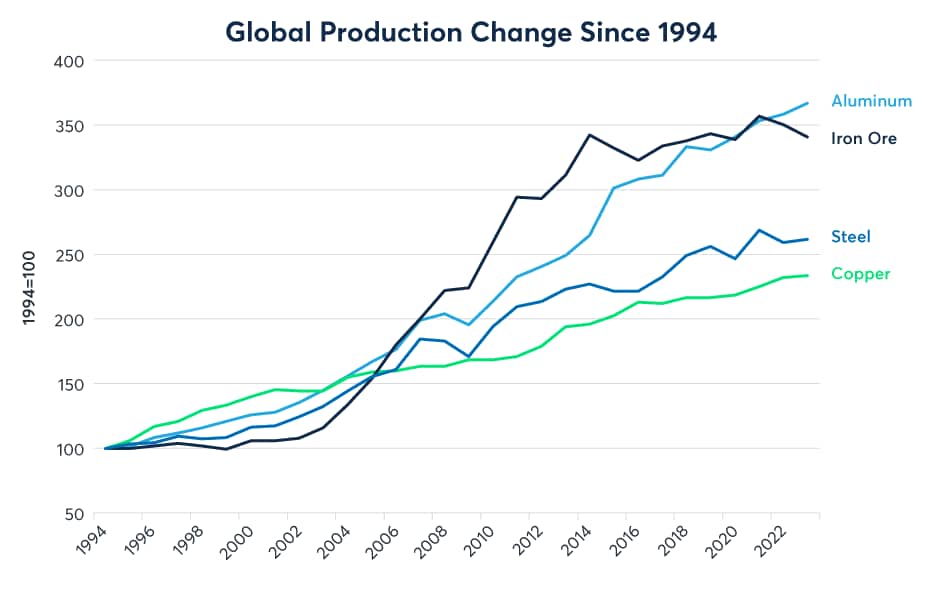
Past performance is not indicative of future results.
The energy transition influence on copper prices is most obvious when comparing copper prices to two drivers that previously dominated copper price movements. The first is crude oil. Due to the energy-intensive nature of copper mining, copper prices generally up until 2022 moved in tandem with crude oil. In November 2022, on the heels of the enactment of the Inflation Reduction Act, that relationship changed. The combination of $1 trillion of investment in U.S. infrastructure, including money set aside for bolstering the electric grid and $60 billion for electric vehicle recharging stations, and increased demand for EVs in China, sent copper prices soaring relative to crude oil (Figure 6).
Figure 6: Copper prices have diverged from crude oil prices since 2022
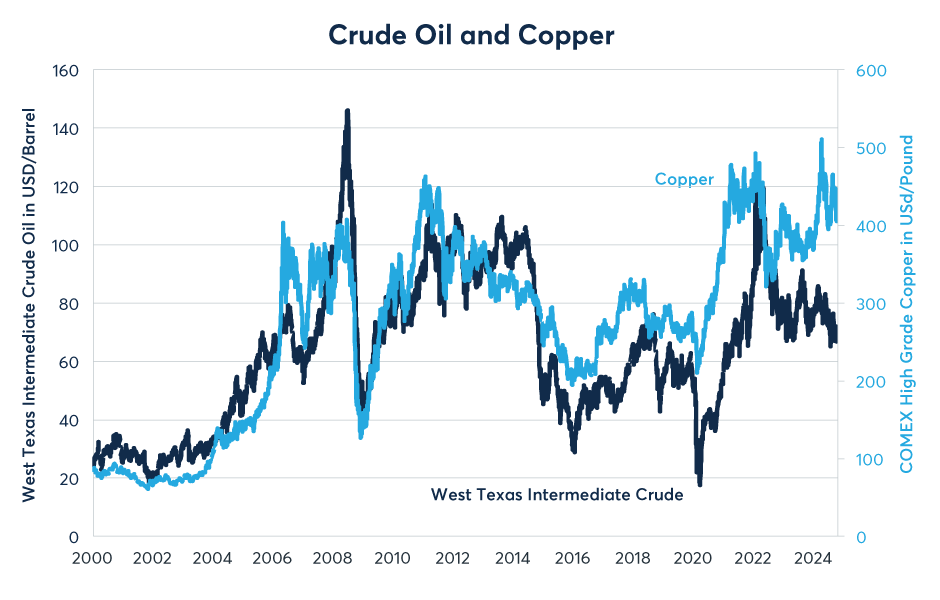
Past performance is not indicative of future results.
At the same time, copper prices also decoupled from Chinese growth, which, until 2021, typically followed with a lag of roughly one year (Figures 7). Since 2021, the Chinese economy has slowed dramatically as housing prices and construction both declined, impairing the finances of Chinese households, banks and local governments. The Chinese economy does have bright spots, however, and these include investments in factories and especially in EVs and recharging stations.
Figure 7: Copper prices have diverged from overall Chinese growth since 2022
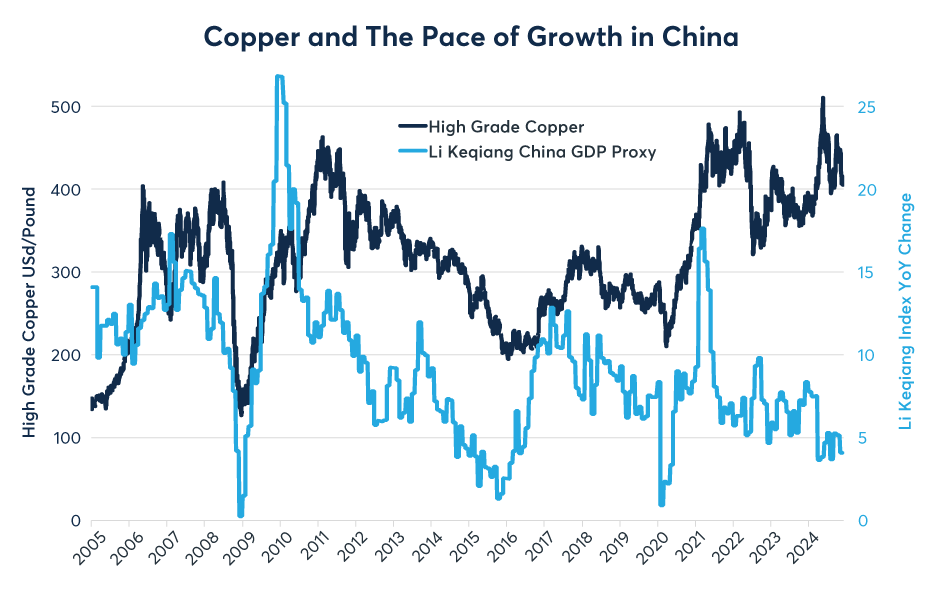
Past performance is not indicative of future results.
While copper prices have diverged from those of crude oil and the pace of growth in China, up until about six months ago, they adhered closely to the performance of the U.S. equity market, rising more or less in tandem with the S&P 500. Since copper prices peaked in May, however, the S&P 500 has outperformed copper significantly (Figure 8). Both copper and equities act as indicators of the health of the economy, but they measure different aspects of economic growth. Copper is a barometer of the health of global industry, whereas equity markets, at least in theory, are more concerned with the discounted value of future earnings.
Figure 8: Equity prices continued to rise in May, leaving copper behind
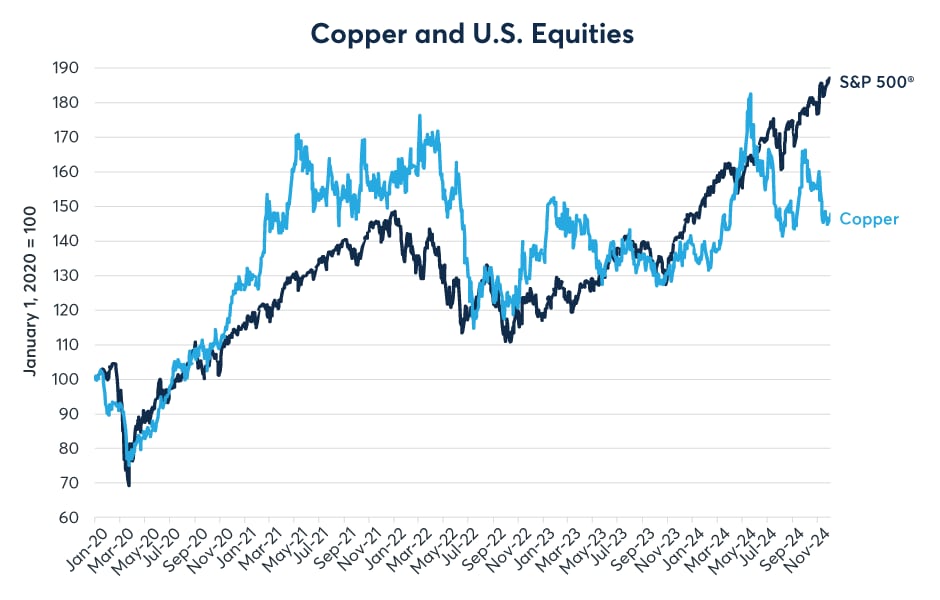
Past performance is not indicative of future results.
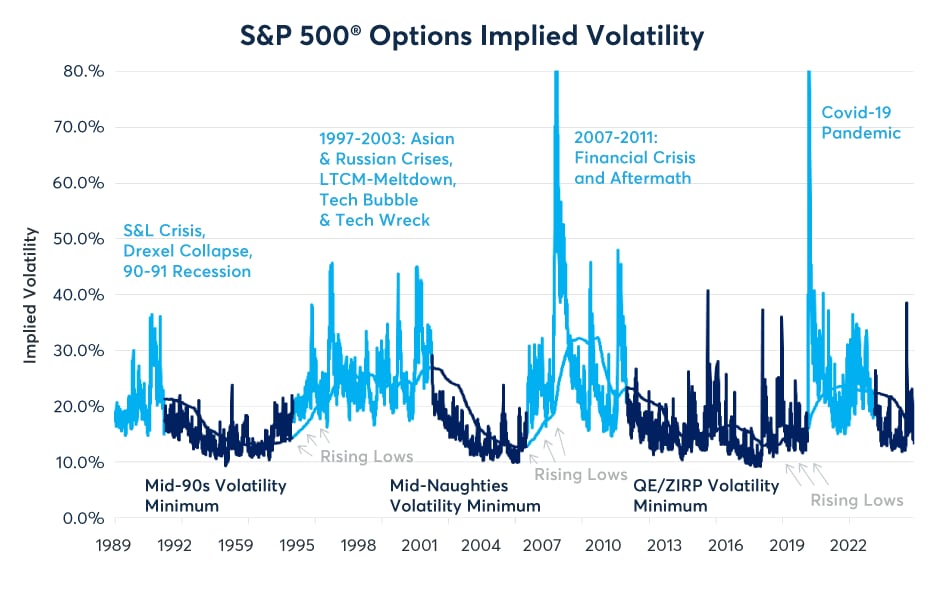
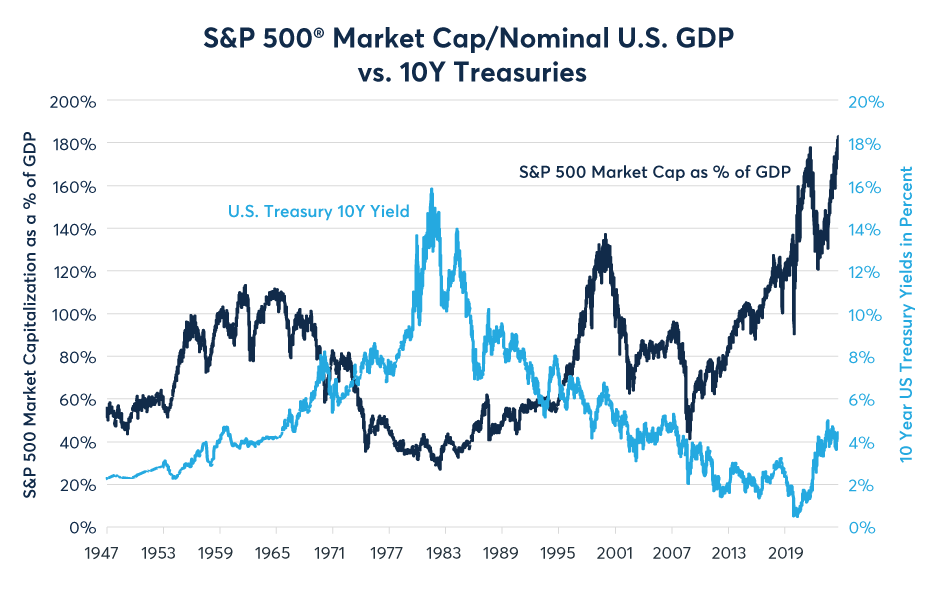
Curiously, equity options are much cheaper than copper options at the moment. Despite geopolitical conflicts, new economic policies under the incoming U.S. Administration and relatively tight monetary policy around the world, equity options are selling just about as inexpensively as they ever have (Figure 9). Moreover, the U.S. equity market now accounts for 74% of the market cap of all developed equity markets around the world and is trading at its highest percentage share of GDP in history (Figure 10). If the U.S. equity market continues to go higher, it could support copper prices. By contrast, were the U.S. equity market to correct, it could put downward pressure on the value of the red metal.
Figure 9: Implied volatility on S&P 500 options is about as low as it has ever been
Past performance is not indicative of future results.
Figure 10: High valuation levels for U.S. equities could pose a risk for copper as well
Past performance is not indicative of future results.
Finally, there is the state of the global housing market. Outside of China, which has a surplus of residential real estate, most other countries, from Australia and Canada to France, the U.K. and U.S., have a housing shortage. As public policies in these nations turn toward building new homes, that could also boost copper demand.
Amid its changing relationship with crude oil, the Chinese economy, equity markets and the housing sector, copper will remain in the crosscurrents of many different market forces in 2025 amid continued slow growth in supply. This could make the copper options market especially interesting next year, especially with the advent of weekly options, which offer traders a more precise way to time their risk management and risk allocation than was available previously.
Disclosure: CME Group
© [2023] CME Group Inc. All rights reserved. This information is reproduced by permission of CME Group Inc. and its affiliates under license. CME Group Inc. and its affiliates accept no liability or responsibility for the information contained herein, including but not limited to the currency, accuracy and/or completeness of this information, and delays, interruptions, errors or omissions. This information is an unofficial copy and may not reflect the official and accurate version. For the definitive and up-to-date version of any of this information, please see cmegroup.com.
Disclosure: Interactive Brokers Third Party
Information posted on IBKR Campus that is provided by third-parties does NOT constitute a recommendation that you should contract for the services of that third party. Third-party participants who contribute to IBKR Campus are independent of Interactive Brokers and Interactive Brokers does not make any representations or warranties concerning the services offered, their past or future performance, or the accuracy of the information provided by the third party. Past performance is no guarantee of future results.
This material is from CME Group and is being posted with its permission. The views expressed in this material are solely those of the author and/or CME Group and Interactive Brokers is not endorsing or recommending any investment or trading discussed in the material. This material is not and should not be construed as an offer to buy or sell any security. It should not be construed as research or investment advice or a recommendation to buy, sell or hold any security or commodity. This material does not and is not intended to take into account the particular financial conditions, investment objectives or requirements of individual customers. Before acting on this material, you should consider whether it is suitable for your particular circumstances and, as necessary, seek professional advice.
Disclosure: Options Trading
Options involve risk and are not suitable for all investors. For information on the uses and risks of options read the "Characteristics and Risks of Standardized Options" also known as the options disclosure document (ODD). Multiple leg strategies, including spreads, will incur multiple transaction costs.


Join The Conversation
If you have a general question, it may already be covered in our FAQs page. go to: IBKR Ireland FAQs or IBKR U.K. FAQs. If you have an account-specific question or concern, please reach out to Client Services: IBKR Ireland or IBKR U.K..
Visit IBKR U.K. Open an IBKR U.K. Account